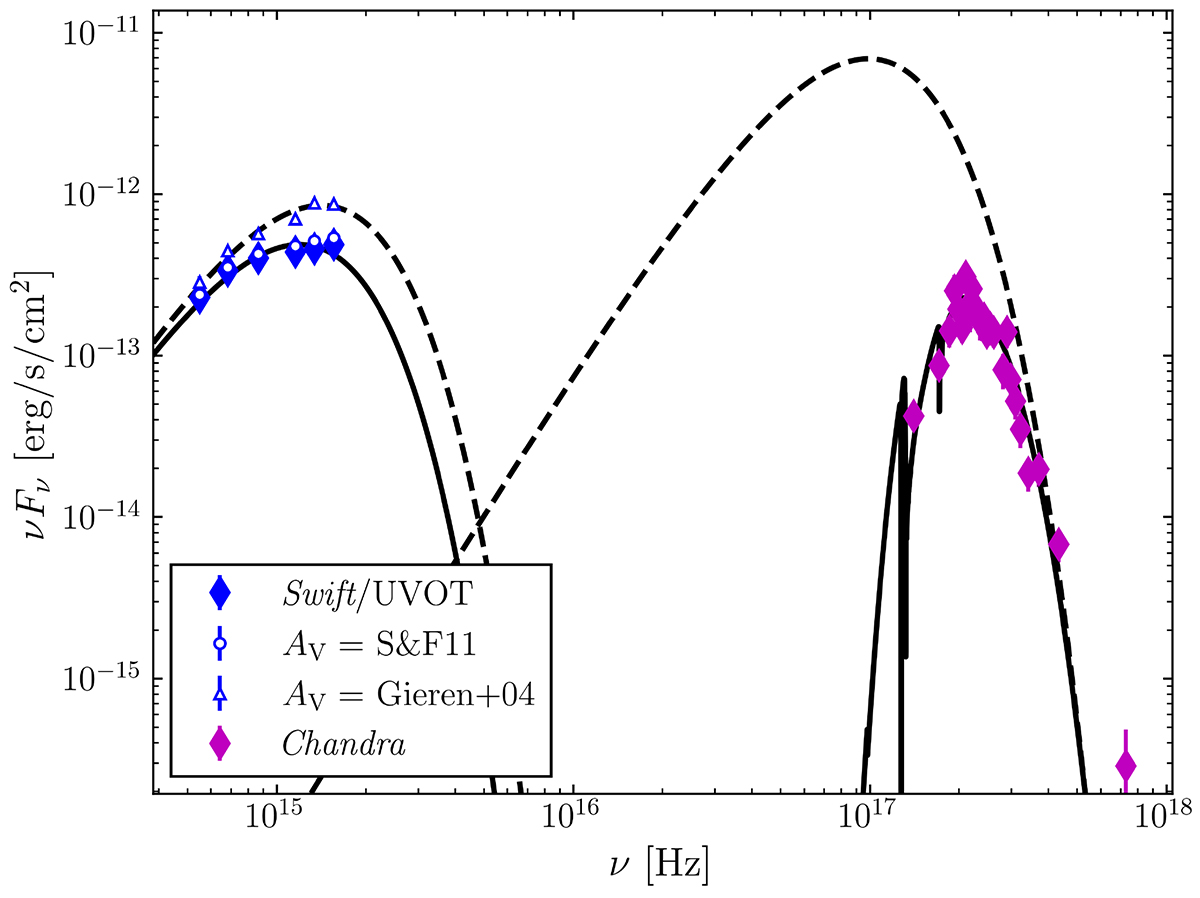
Fig. 8.
Download original image
Full SED of J0054. The magenta and blue diamonds show the Chandra and Swift/UVOT data, respectively. The black solid lines show the two independent best-fitting models for the two components with no absorption correction, and the dashed black lines show the de-absorbed models. For Swift/UVOT, the full markers indicate the observed flux, while the empty blue markers the de-absorbed fluxes, corrected following the different values discussed in the text (the full markers lie under the empty ones). For Chandra, the de-absorbed model was obtained by setting to 0 the amount of NH.
Current usage metrics show cumulative count of Article Views (full-text article views including HTML views, PDF and ePub downloads, according to the available data) and Abstracts Views on Vision4Press platform.
Data correspond to usage on the plateform after 2015. The current usage metrics is available 48-96 hours after online publication and is updated daily on week days.
Initial download of the metrics may take a while.