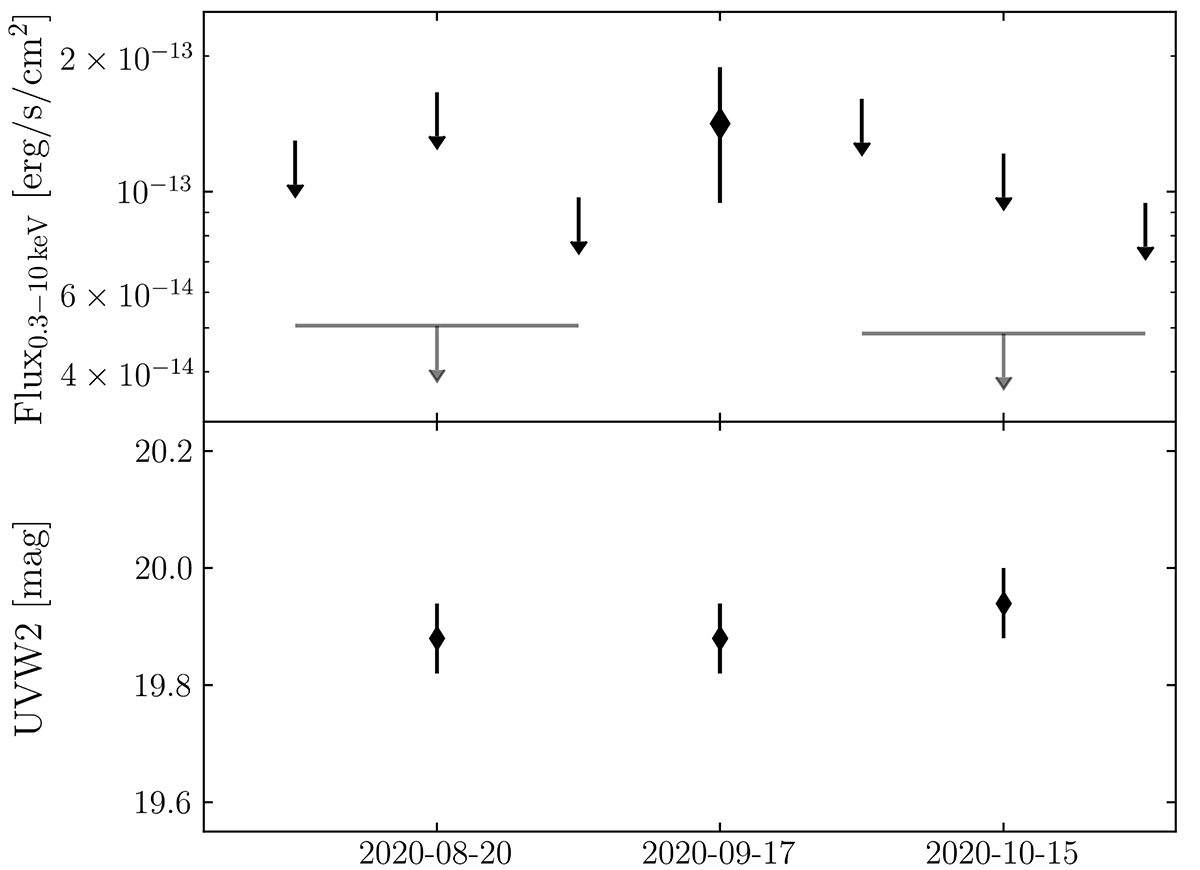
Fig. 6.
Download original image
X-ray flux (upper panel) and UVW2 AB magnitude (lower panel) evolution during the flare detected in the September 2020 Swift data. The X-ray upper limits in the single observations are reported as black arrows; the upper limits derived from the merged observations are reported as grey arrows. UVW2 magnitudes for each of the three epochs were derived by merging the single orbit exposures.
Current usage metrics show cumulative count of Article Views (full-text article views including HTML views, PDF and ePub downloads, according to the available data) and Abstracts Views on Vision4Press platform.
Data correspond to usage on the plateform after 2015. The current usage metrics is available 48-96 hours after online publication and is updated daily on week days.
Initial download of the metrics may take a while.