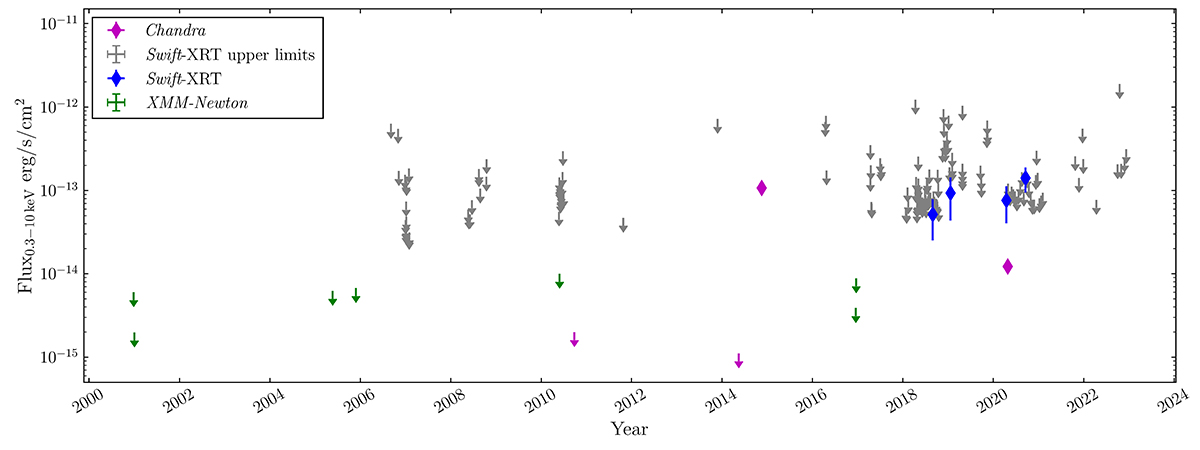
Fig. 3.
Download original image
Long-term X-ray light curve of J0054. The magenta and green data refer to Chandra and XMM-Newton data, respectively; the down-pointing arrows indicate 3σ upper limits, while the diamond markers indicate detections (with 1σ error bars). Swift/XRT detections are shown as blue diamonds, while the upper limits are indicated by down-pointing grey arrows. Count rates for the upper limits and for the Swift/XRT detections were converted to fluxes assuming the same spectral shape of the Chandra 2014 detection. Years are on the X-axis and flux in the 0.3–10 keV band is on the Y-axis.
Current usage metrics show cumulative count of Article Views (full-text article views including HTML views, PDF and ePub downloads, according to the available data) and Abstracts Views on Vision4Press platform.
Data correspond to usage on the plateform after 2015. The current usage metrics is available 48-96 hours after online publication and is updated daily on week days.
Initial download of the metrics may take a while.