Fig. 3
Download original image
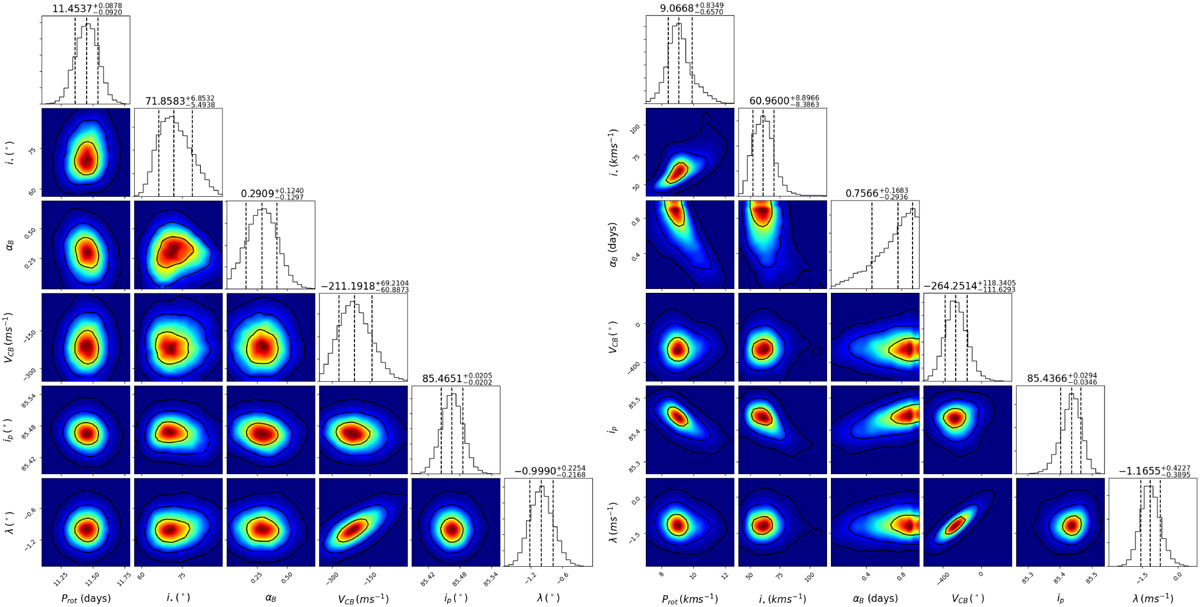
Posterior distribution diagrams for M1 and M2. The corner plots depict the posterior distribution for the equatorial rotation period, stellar axis inclination, differential rotation coefficient, local CB velocity, and projected spin-orbit angle. The black contour lines represent (from the center outward) the confidence intervals enclosing 68.27%, 95.45%, and 99.73% of the accepted samples. The histograms display the parameter posterior distributions, with the darker dashed line indicating the median value and lighter lines delimiting the 1-sigma interval.
Current usage metrics show cumulative count of Article Views (full-text article views including HTML views, PDF and ePub downloads, according to the available data) and Abstracts Views on Vision4Press platform.
Data correspond to usage on the plateform after 2015. The current usage metrics is available 48-96 hours after online publication and is updated daily on week days.
Initial download of the metrics may take a while.