Fig. 2
Download original image
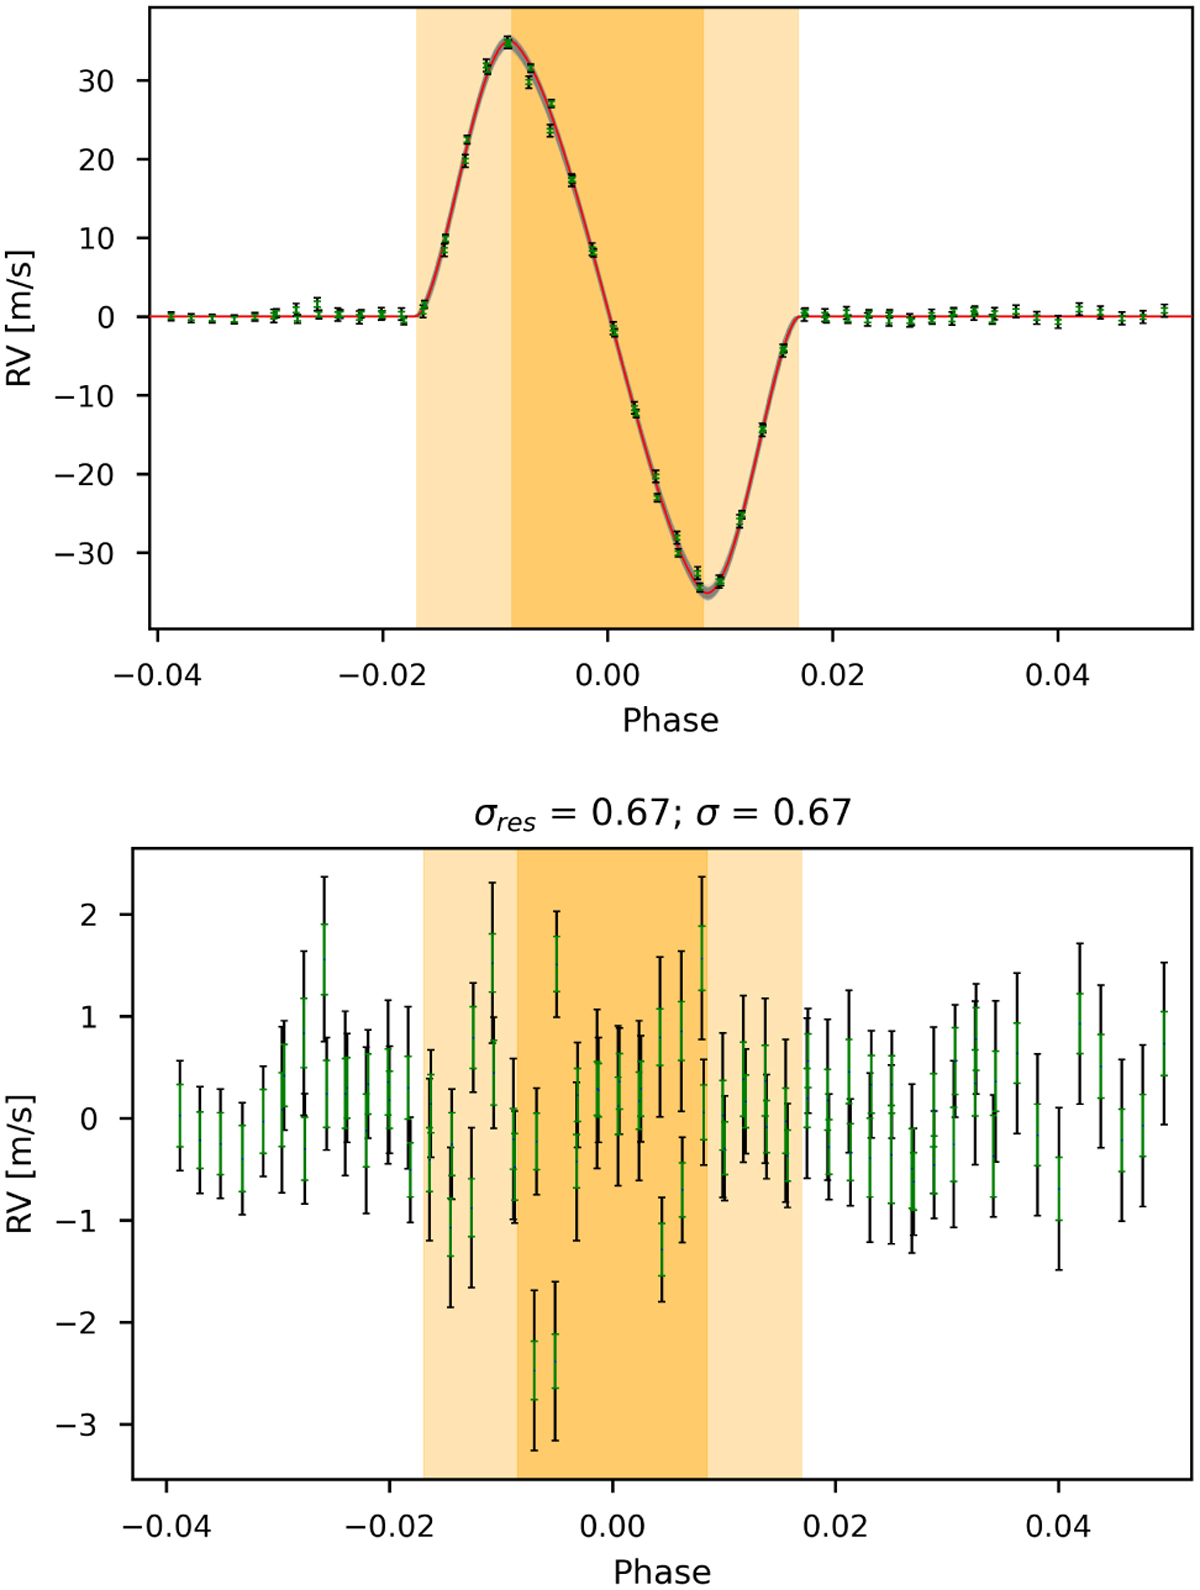
Fit and residuals of the white-light data. Top: the best-fit model (solid red line) obtained from the combined data of the nights observed with ESPRESSO. Bottom: residuals after subtracting the model. The darker orange areas represent the phases where the planet is fully inside the stellar disk, while the lighter orange regions correspond to the ingress and egress phases. The data points are represented with two error bars. The green error bar is computed from the CCF, assuming a photon-noise-limited observation. The black error bar is obtained by adding in quadrature the value of the green error bar and the jitter amplitude. At the top of the bottom figure, two quantities are presented. The first is the average dispersion of the residual RVs (σres) in units of m s−1. The second is the average value of the black error bars, also given in m s−1.
Current usage metrics show cumulative count of Article Views (full-text article views including HTML views, PDF and ePub downloads, according to the available data) and Abstracts Views on Vision4Press platform.
Data correspond to usage on the plateform after 2015. The current usage metrics is available 48-96 hours after online publication and is updated daily on week days.
Initial download of the metrics may take a while.