Fig. D.2
Download original image
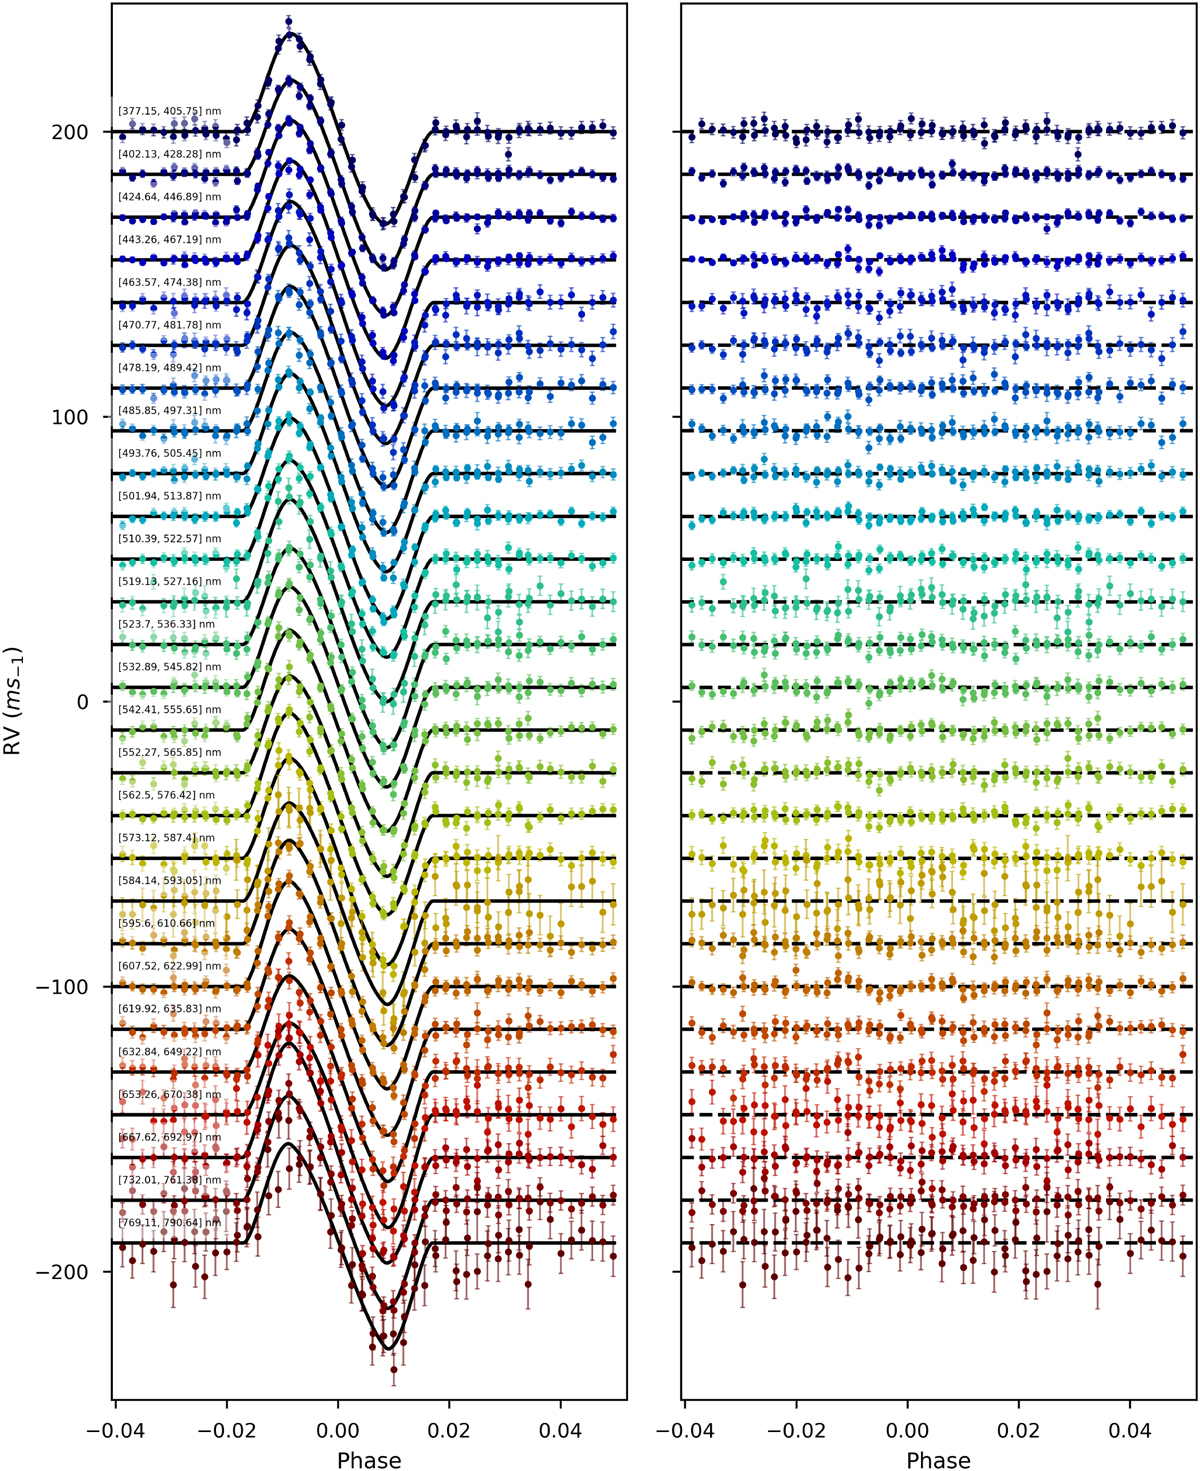
Chromatic RM fits and corresponding residuals. Left: The RVs computed for the chromatic ranges and the best-fit model (black line). Right: Residuals after subtracting the data of the model corresponding to the best solution. The RV data, models, and corresponding residuals are shifted by 15m s−1 increments for better visualization.
Current usage metrics show cumulative count of Article Views (full-text article views including HTML views, PDF and ePub downloads, according to the available data) and Abstracts Views on Vision4Press platform.
Data correspond to usage on the plateform after 2015. The current usage metrics is available 48-96 hours after online publication and is updated daily on week days.
Initial download of the metrics may take a while.