Fig. D.1
Download original image
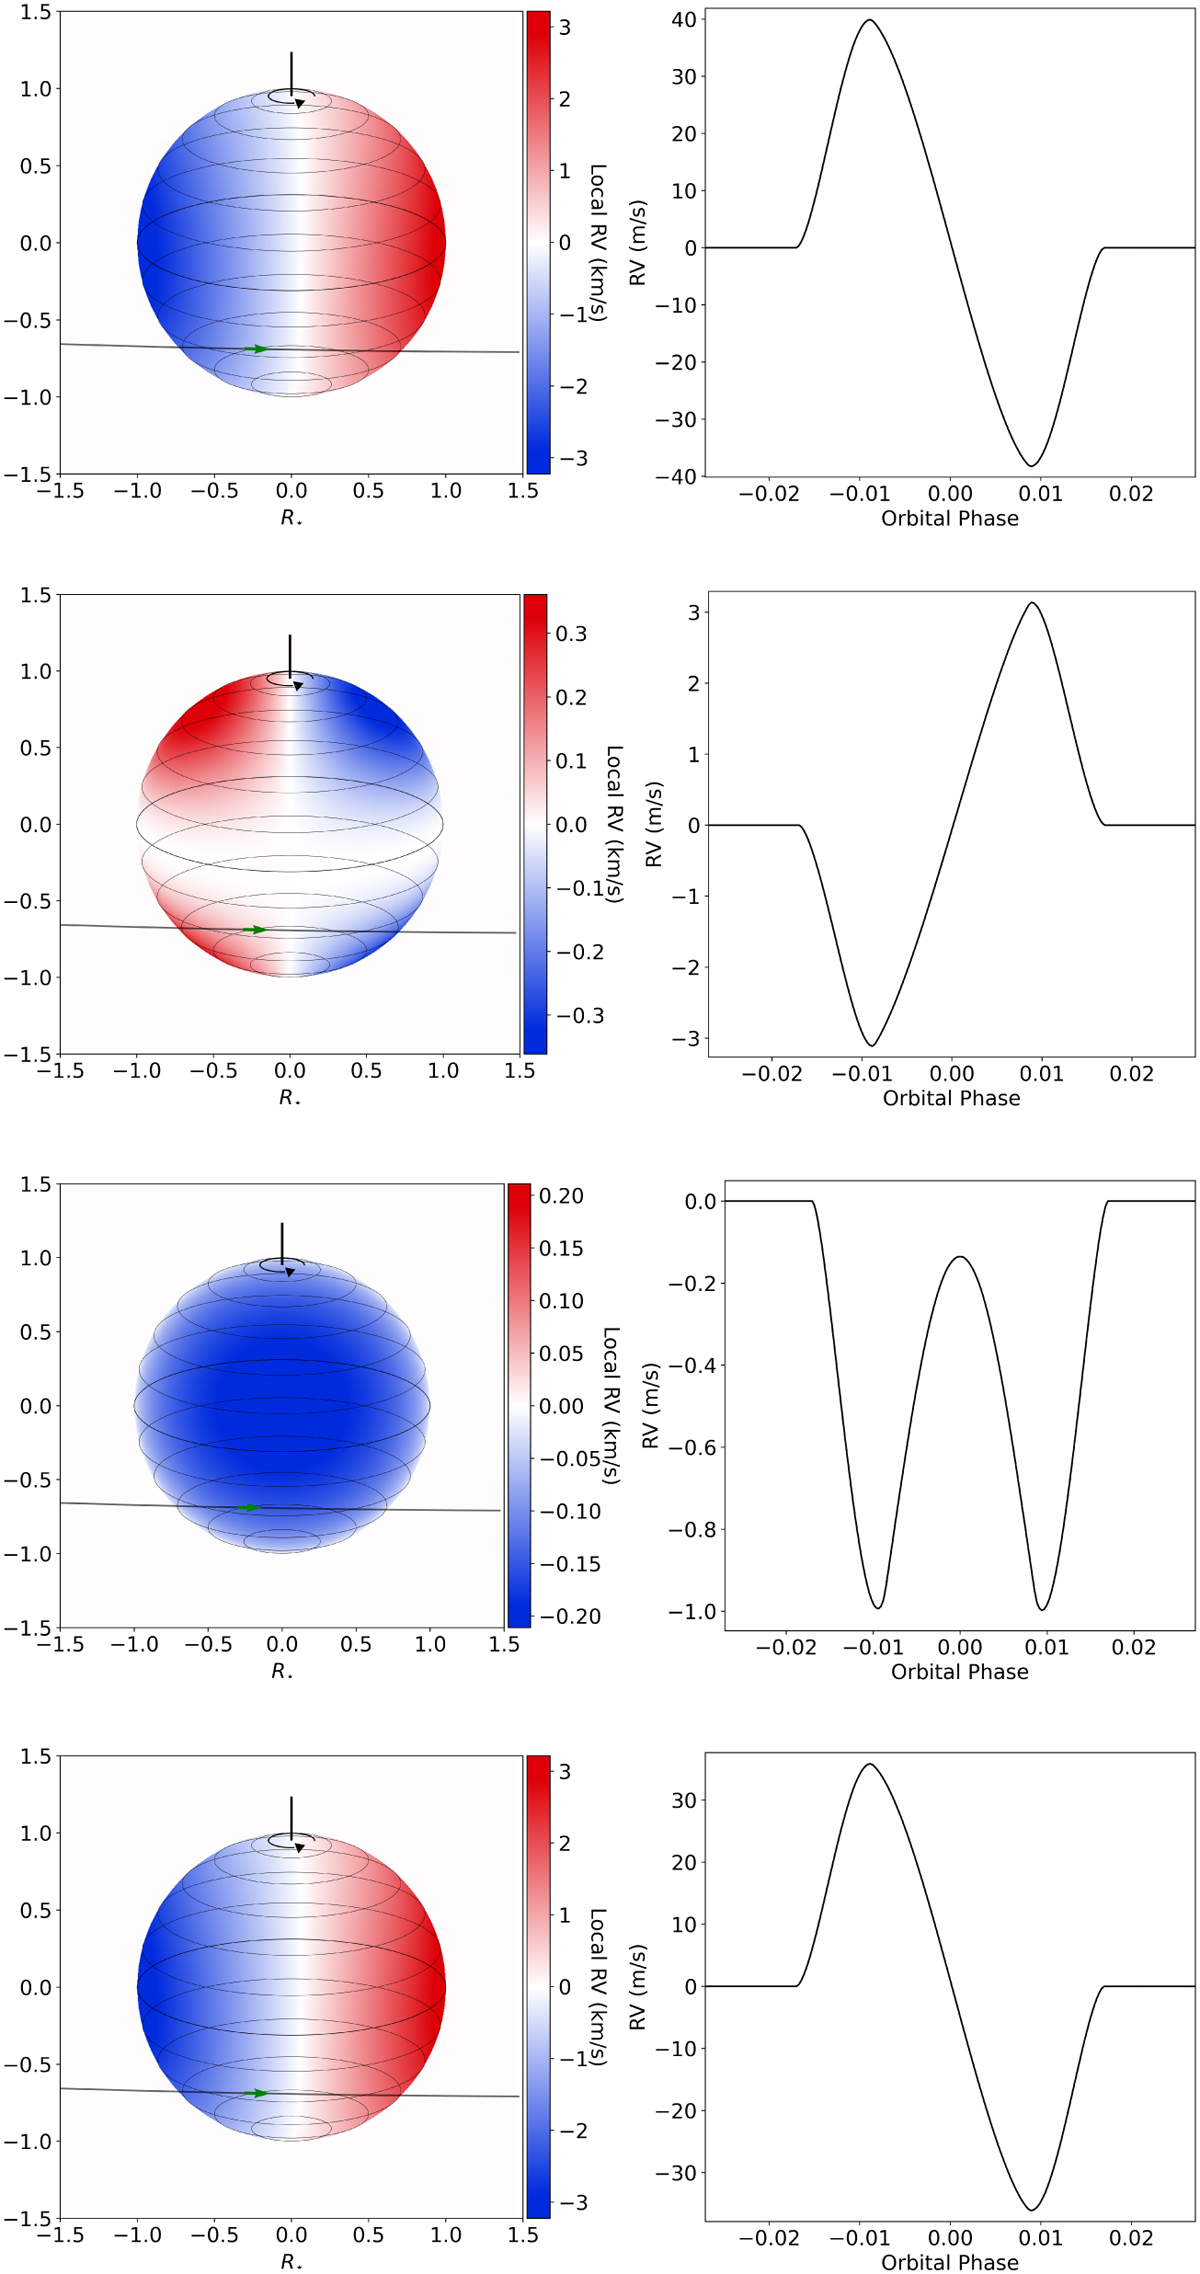
Decomposition of the Doppler surface maps and corresponding RV anomaly produced by the transiting exoplanet. Left: Doppler maps of the stellar surface for the best-fit solution for the HD 189733 data. The black lines over the maps show the latitudinal lines in intervals of 15°. The curved black and straight green arrows indicate the rotation direction of the star and the planet along its orbits, respectively. Right: RV anomaly created by the transiting exoplanet for the corresponding (same row) Doppler map. From top to bottom: rigid-body rotation model for the equatorial stellar velocity, the difference after subtracting the rigid-body rotation model from the differential rotation model, the CB, and the sum of all the previously mentioned components.
Current usage metrics show cumulative count of Article Views (full-text article views including HTML views, PDF and ePub downloads, according to the available data) and Abstracts Views on Vision4Press platform.
Data correspond to usage on the plateform after 2015. The current usage metrics is available 48-96 hours after online publication and is updated daily on week days.
Initial download of the metrics may take a while.