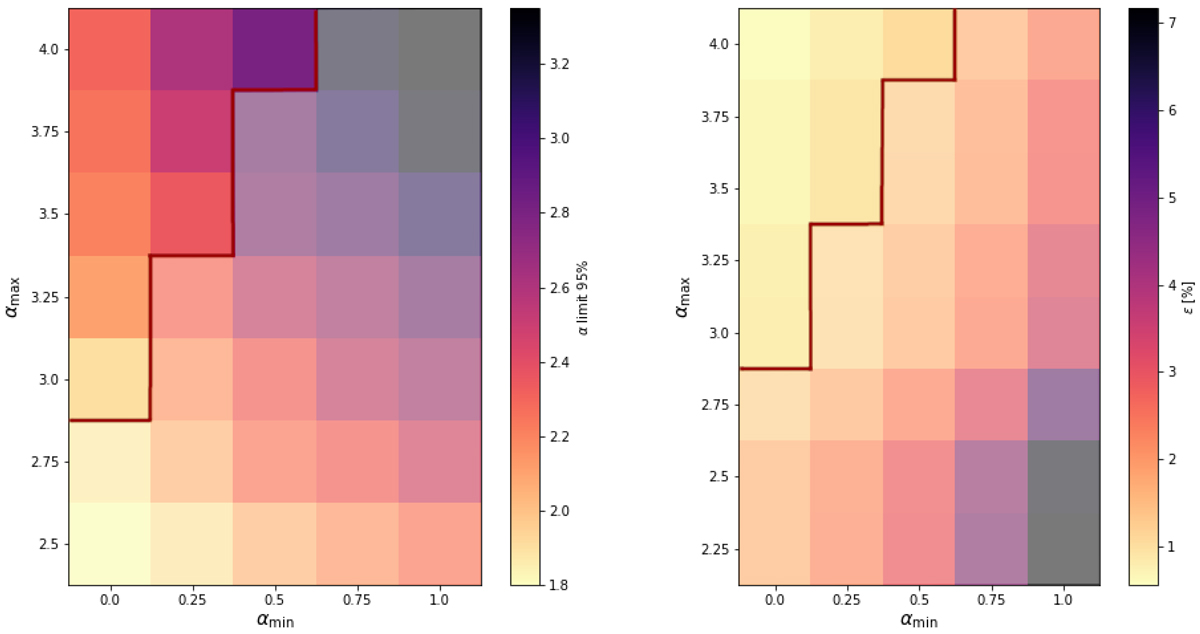
Fig. 7.
Download original image
The effect of the spectral index range on the limit result. Left: lower limits at 95% confidence level as a function of spectral index range. The lower and upper bounds of the range can vary between 0 ≤ αmin ≤ 1 and 0 ≤ αmax ≤ 4, respectively. Values above the red line satisfy the criterion of convergence of the cumulative distribution (see right panel). We adopted a lower limit, α > 2.2, obtained using the αmin = 0 ≤ α ≤ 4 = αmax range. Right: convergence of the cumulative probability function with varying spectral index ranges. Values above the red line have ϵ < 1%, which we used as an acceptance criterion (see Eq. (5)).
Current usage metrics show cumulative count of Article Views (full-text article views including HTML views, PDF and ePub downloads, according to the available data) and Abstracts Views on Vision4Press platform.
Data correspond to usage on the plateform after 2015. The current usage metrics is available 48-96 hours after online publication and is updated daily on week days.
Initial download of the metrics may take a while.