Open Access
Fig. 1.
Download original image
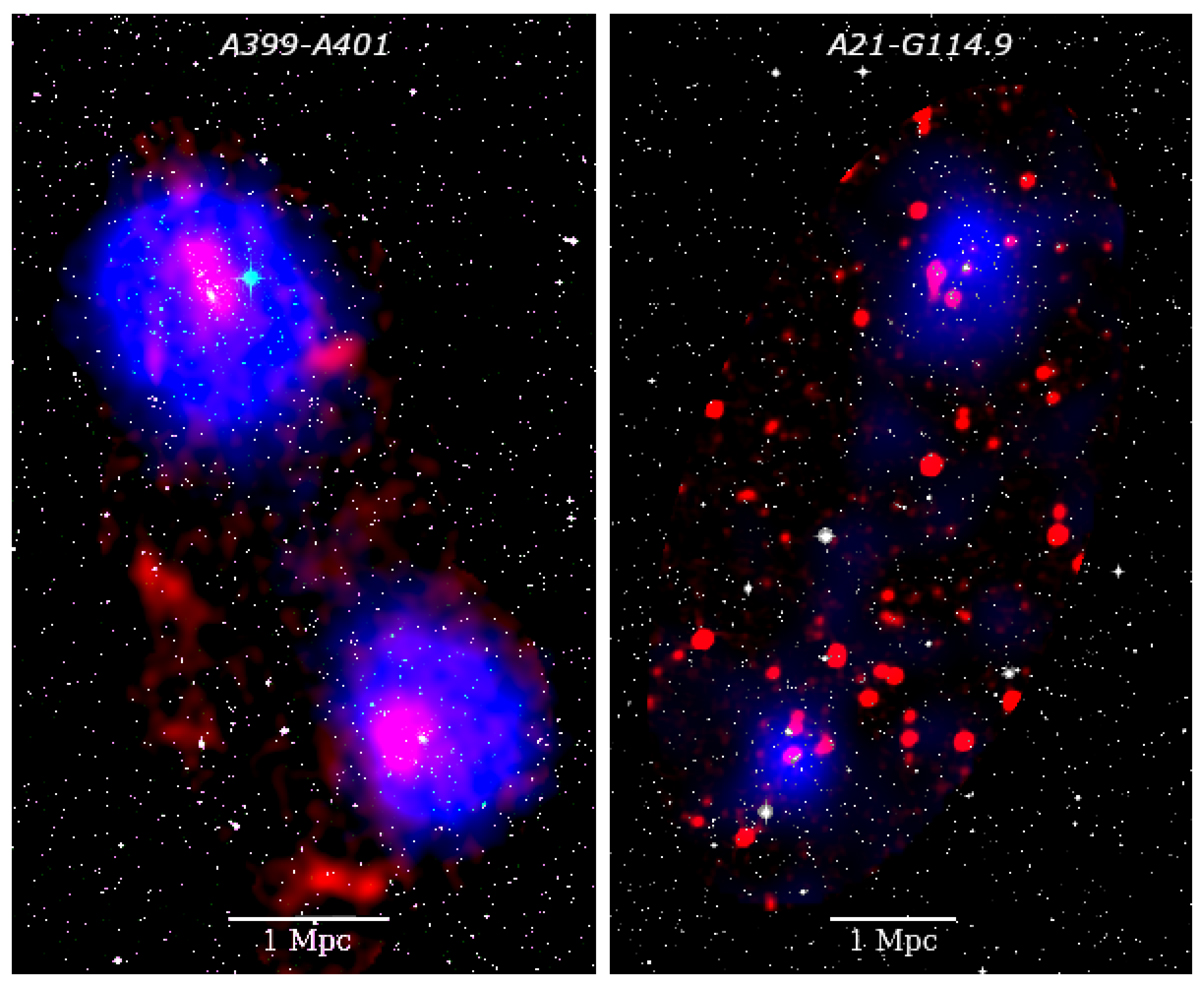
Composite image of the A399-A401 (left) and A21-G114.9 (right) cluster pairs. Optical data are recovered from the DSS, while X-ray data (ASCA for A399-A401, ROSAT for A21-G114.9) are shown in blue, and uGMRT data from this work are overlaid in red.
Current usage metrics show cumulative count of Article Views (full-text article views including HTML views, PDF and ePub downloads, according to the available data) and Abstracts Views on Vision4Press platform.
Data correspond to usage on the plateform after 2015. The current usage metrics is available 48-96 hours after online publication and is updated daily on week days.
Initial download of the metrics may take a while.