Fig. 9.
Download original image
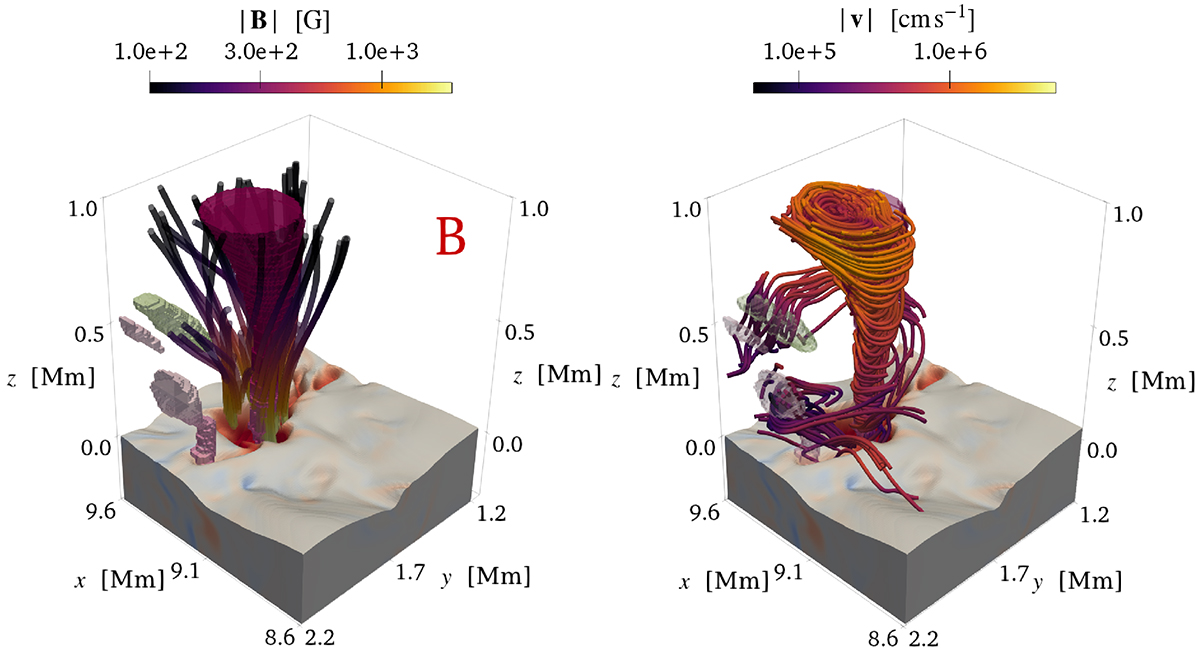
Three-dimensional rendering of an isolated swirling structure stemming from a relatively small photospheric magnetic flux concentration. Left: Identified three-dimensional swirls colored according to the mean Rortex value R, as in Fig. 7. Thick tubes represent magnetic field lines with the intensity of the magnetic field color coded on them. The corrugated surface near z = 0 km represents the τ500 = 1 surface. Right: Instantaneous streamlines of the velocity field belonging to the vortical structures. The strength of the velocity field is color coded on the streamlines.
Current usage metrics show cumulative count of Article Views (full-text article views including HTML views, PDF and ePub downloads, according to the available data) and Abstracts Views on Vision4Press platform.
Data correspond to usage on the plateform after 2015. The current usage metrics is available 48-96 hours after online publication and is updated daily on week days.
Initial download of the metrics may take a while.