Fig. 16.
Download original image
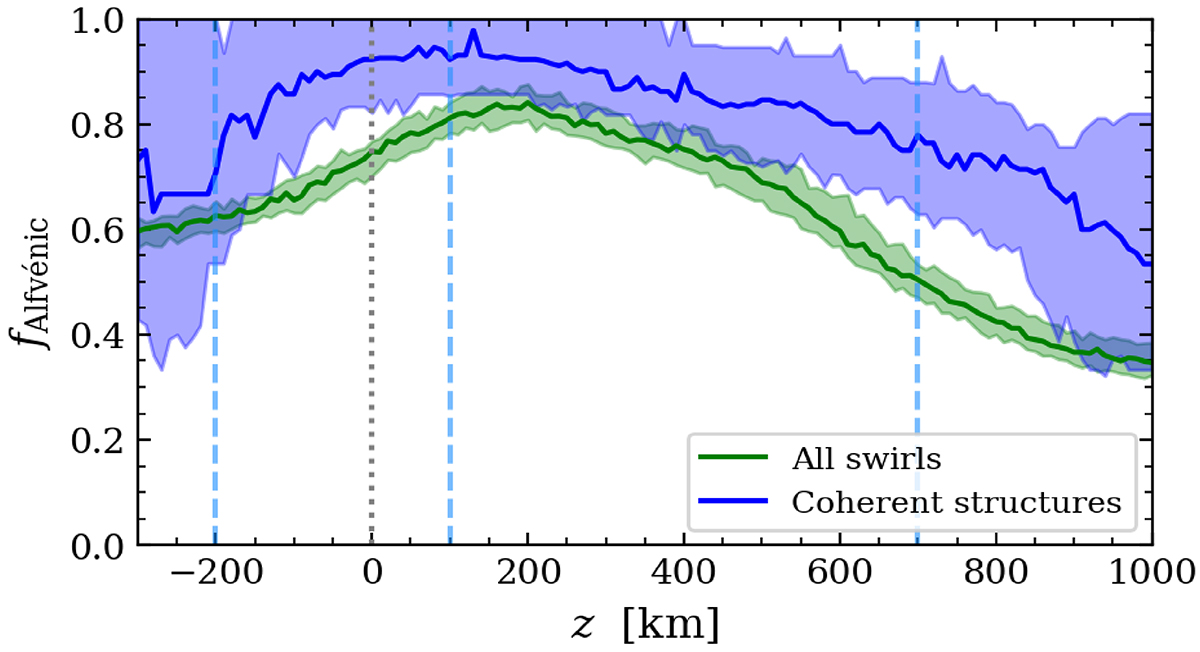
Fraction of swirls obeying Eq. (11), fAlfévnic, as a function of height z. The green profile refers to all identified swirls, while the blue curve takes into account only those swirls that form coherent structures connecting the surface layers (z = 0 km) to the low chromosphere (z = 700 km). Shaded areas represent statistical standard deviations. The average optical surface τ500 = 1 (z = 0 km) is marked by a dotted line, while the heights of the surface layers of the convection zone, photosphere, and low chromosphere used in the analysis are indicated by dashed blue lines.
Current usage metrics show cumulative count of Article Views (full-text article views including HTML views, PDF and ePub downloads, according to the available data) and Abstracts Views on Vision4Press platform.
Data correspond to usage on the plateform after 2015. The current usage metrics is available 48-96 hours after online publication and is updated daily on week days.
Initial download of the metrics may take a while.