Fig. 1.
Download original image
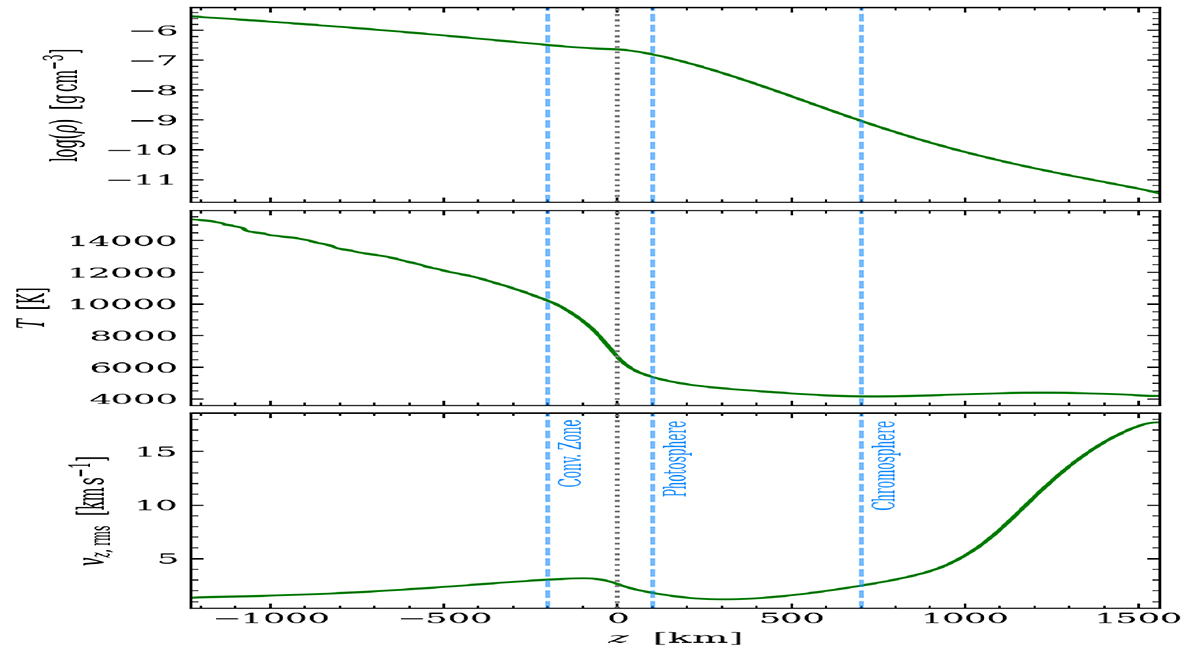
Average stratifications of density, ρ, temperature, T, and rms of the vertical component of the velocity field, vz, rms. The profiles represent averages, both temporally across the 30 time instances of the CO5BOLD simulation, and spatially across the horizontal sections of the domain. The heights for the analysis of swirls in the surface layers of the convection zone (z = −200 km), in the photosphere (z = 100 km), and in the low chromosphere (z = 700 km) are indicated by blue dashed lines.
Current usage metrics show cumulative count of Article Views (full-text article views including HTML views, PDF and ePub downloads, according to the available data) and Abstracts Views on Vision4Press platform.
Data correspond to usage on the plateform after 2015. The current usage metrics is available 48-96 hours after online publication and is updated daily on week days.
Initial download of the metrics may take a while.