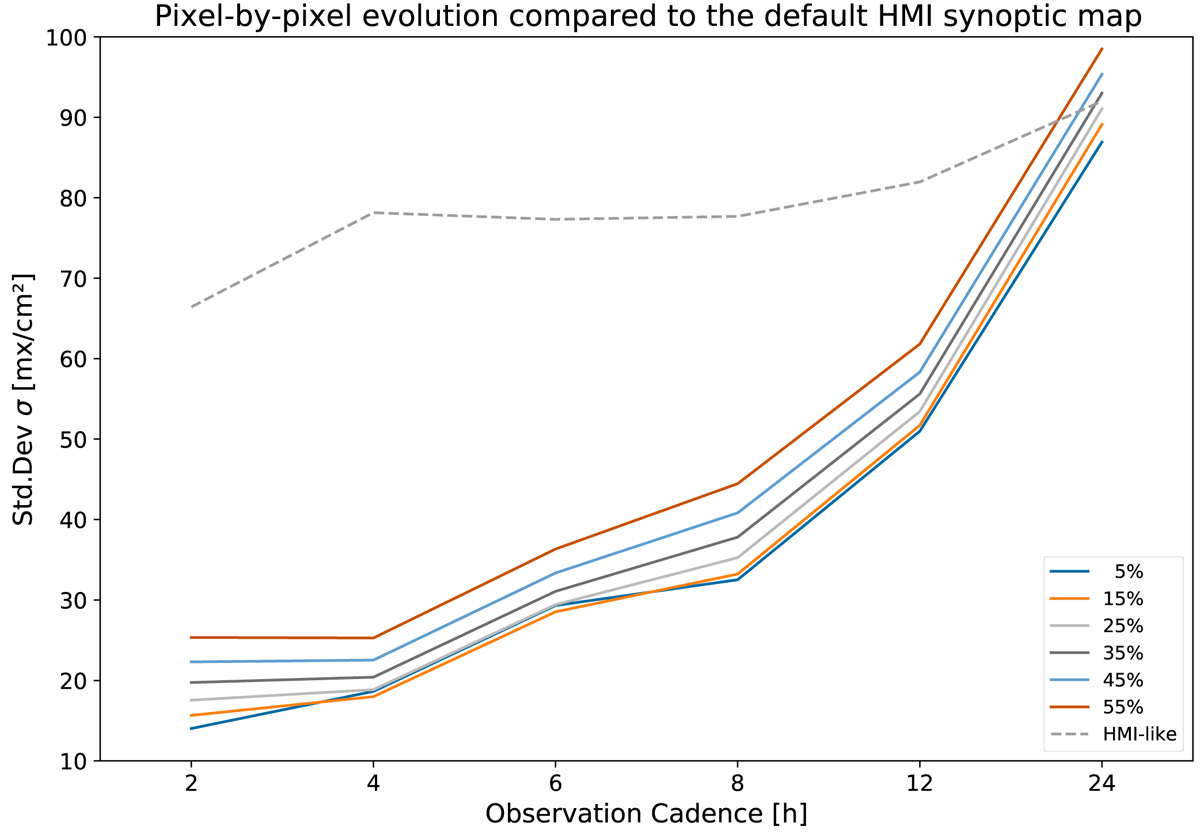
Fig. 8.
Download original image
Standard deviation, σ, of the pixel-by-pixel evolution between the classic SDO/HMI and the weighted synoptic maps for different weight functions from wd = 5% to 55% residual contribution at the adjacent central meridians. The dashed line shows the result for equally weighted HMI-like averaging of the low-cadence observation (see first paragraph of Sect. 2.5).
Current usage metrics show cumulative count of Article Views (full-text article views including HTML views, PDF and ePub downloads, according to the available data) and Abstracts Views on Vision4Press platform.
Data correspond to usage on the plateform after 2015. The current usage metrics is available 48-96 hours after online publication and is updated daily on week days.
Initial download of the metrics may take a while.