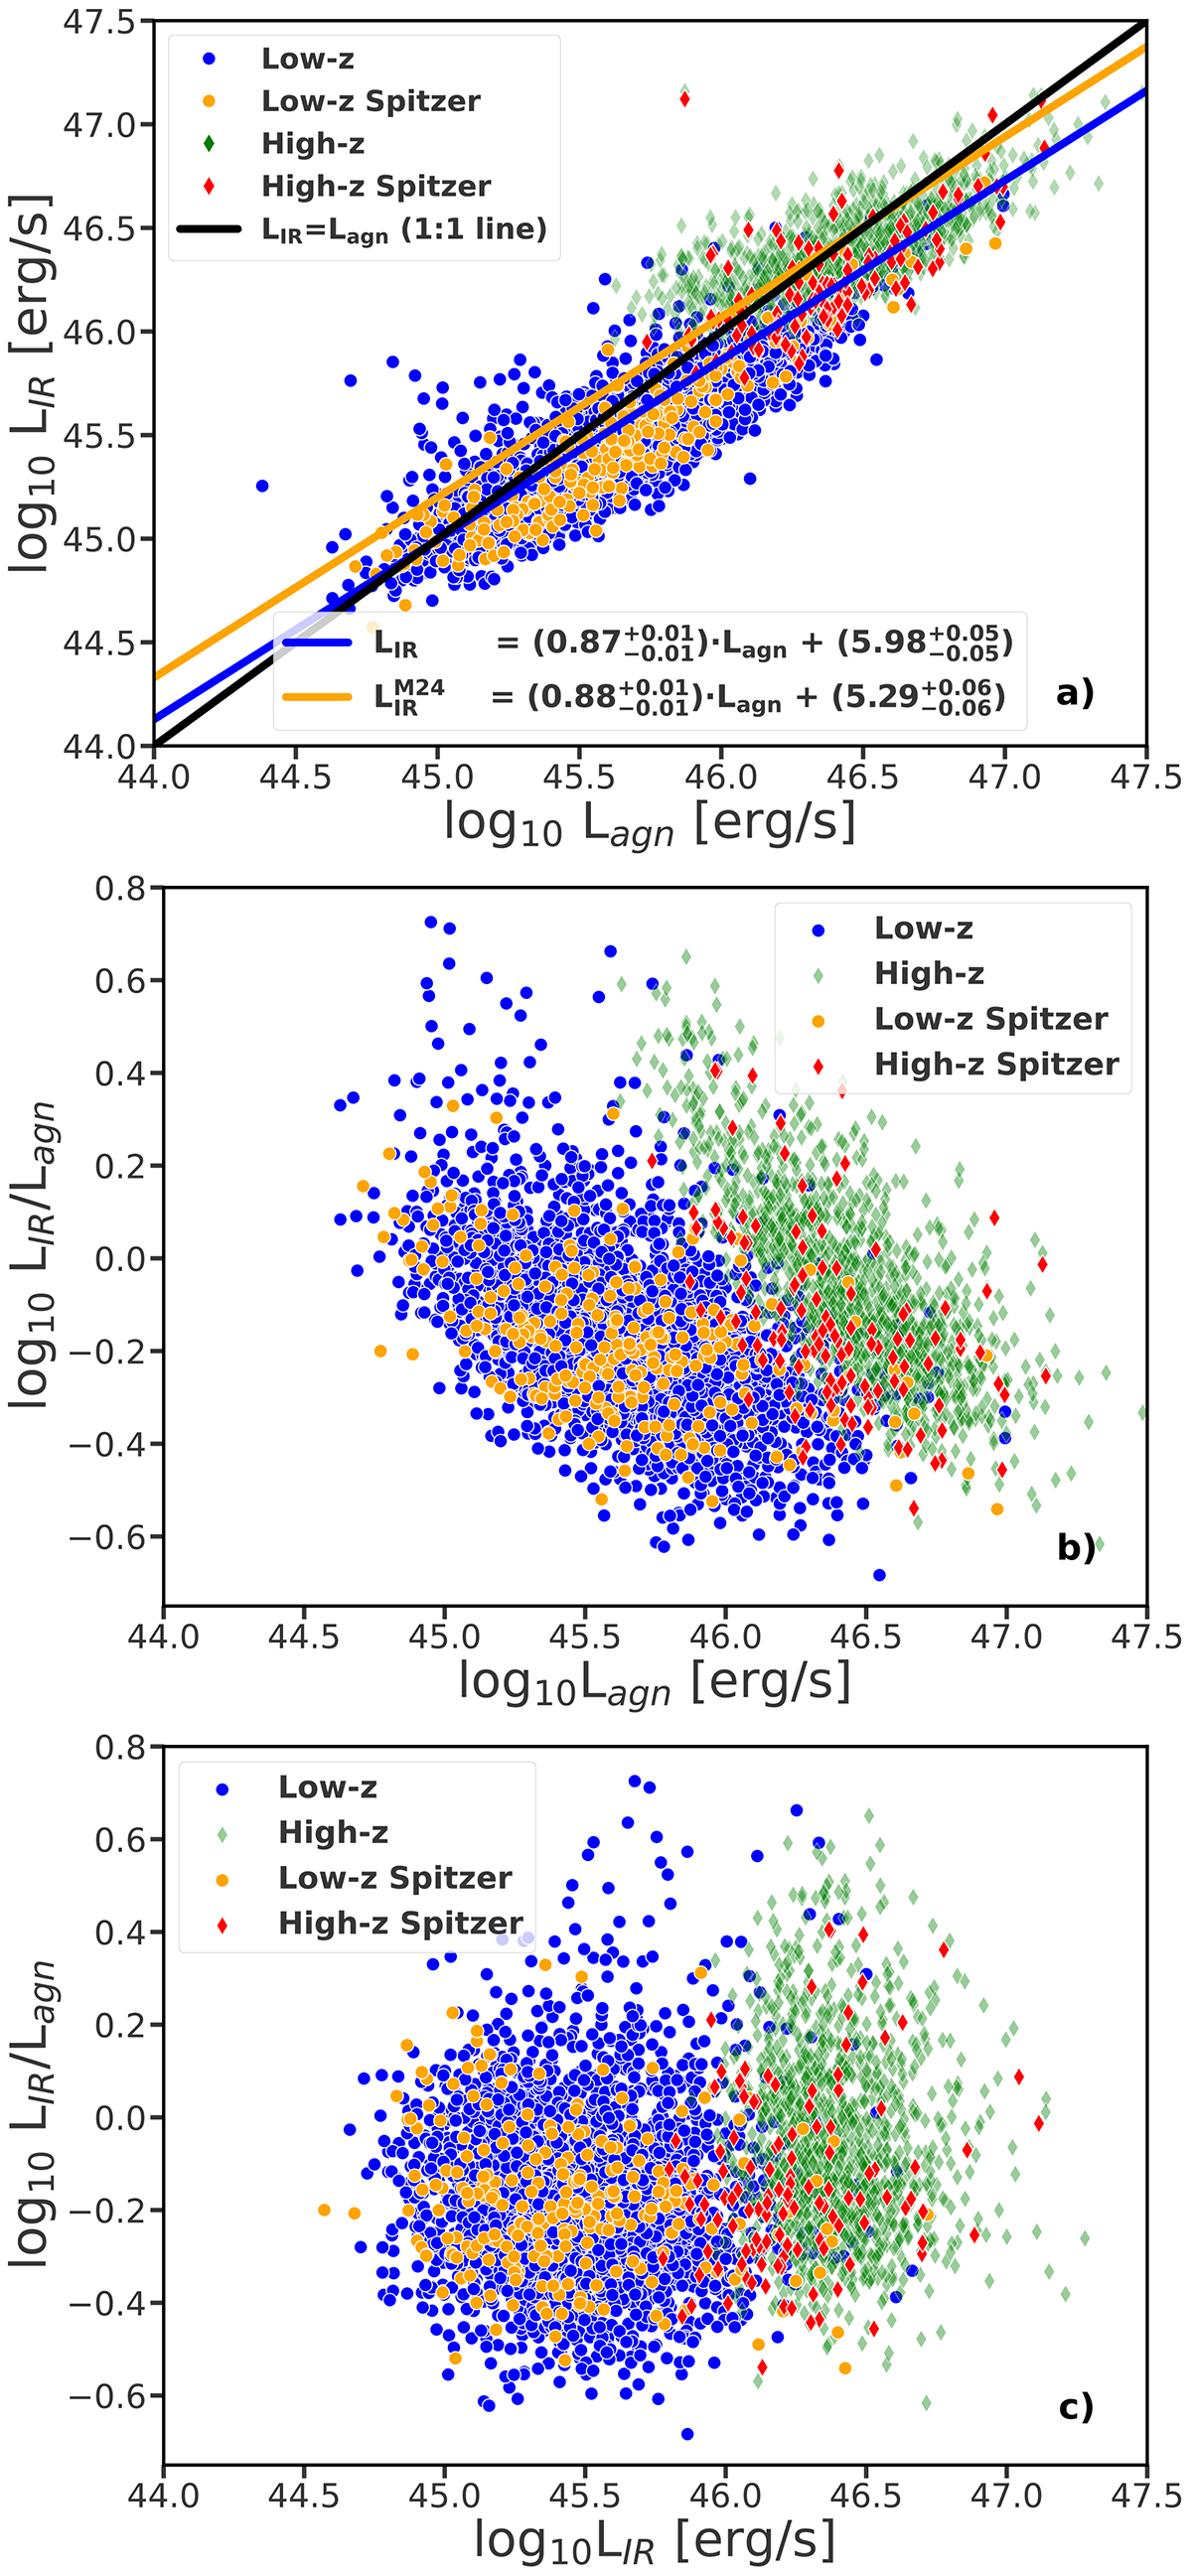
Fig. C.2.
Download original image
Luminosity scalings for the WISE samples of the Low-z and High-z quasars with S/NW3& W4 > 3. The top panel shows log LIR vs log Lagn, the middle panel log CF vs log Lagn, and the bottom panel log CF vs log LIR. The blue circles indicate Low-z quasars, whereas the green and red diamonds indicate High-z sources. The yellow circles and red diamonds indicate Low-z and High-z quasars with the Spitzer M24 data. In the top panel the blue line denotes the Bayesian regression for the data with S/NW3& W4 > 3, the orange line is the Bayesian regression for the Spitzer data from both Low-z and High-z subsamples, and the black line is the 1:1 relation between the LIR and Lagn.
Current usage metrics show cumulative count of Article Views (full-text article views including HTML views, PDF and ePub downloads, according to the available data) and Abstracts Views on Vision4Press platform.
Data correspond to usage on the plateform after 2015. The current usage metrics is available 48-96 hours after online publication and is updated daily on week days.
Initial download of the metrics may take a while.