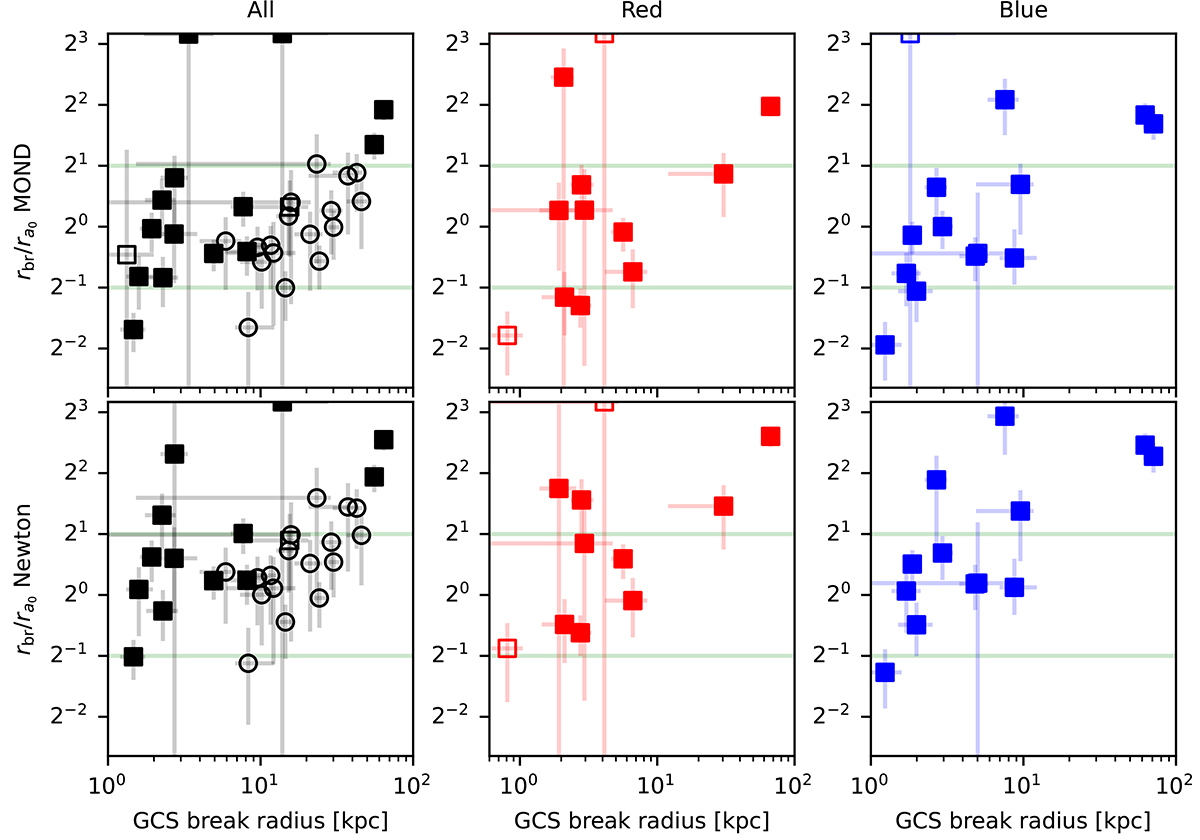
Fig. 5.
Download original image
Demonstration of the approximate equality of the break radii of the GCSs and the a0 radii of their host galaxies. First row: the ratio of the break radius and the MOND a0 radius as a function of the break radius. The vertical axis is in the base-2 logarithmic scale, while the horizontal axis in the base-10 logarithmic scale. The horizontal line indicates the ratio of one (the break and a0 radii are equal). Second row: the same as the first row but for the a0 radii calculated for the Newtonian gravity. Columns: from left to right, the rows show the data derived for all GCs and for the red and blue subpopulations of GCs.
Current usage metrics show cumulative count of Article Views (full-text article views including HTML views, PDF and ePub downloads, according to the available data) and Abstracts Views on Vision4Press platform.
Data correspond to usage on the plateform after 2015. The current usage metrics is available 48-96 hours after online publication and is updated daily on week days.
Initial download of the metrics may take a while.