Open Access
Fig. 8.
Download original image
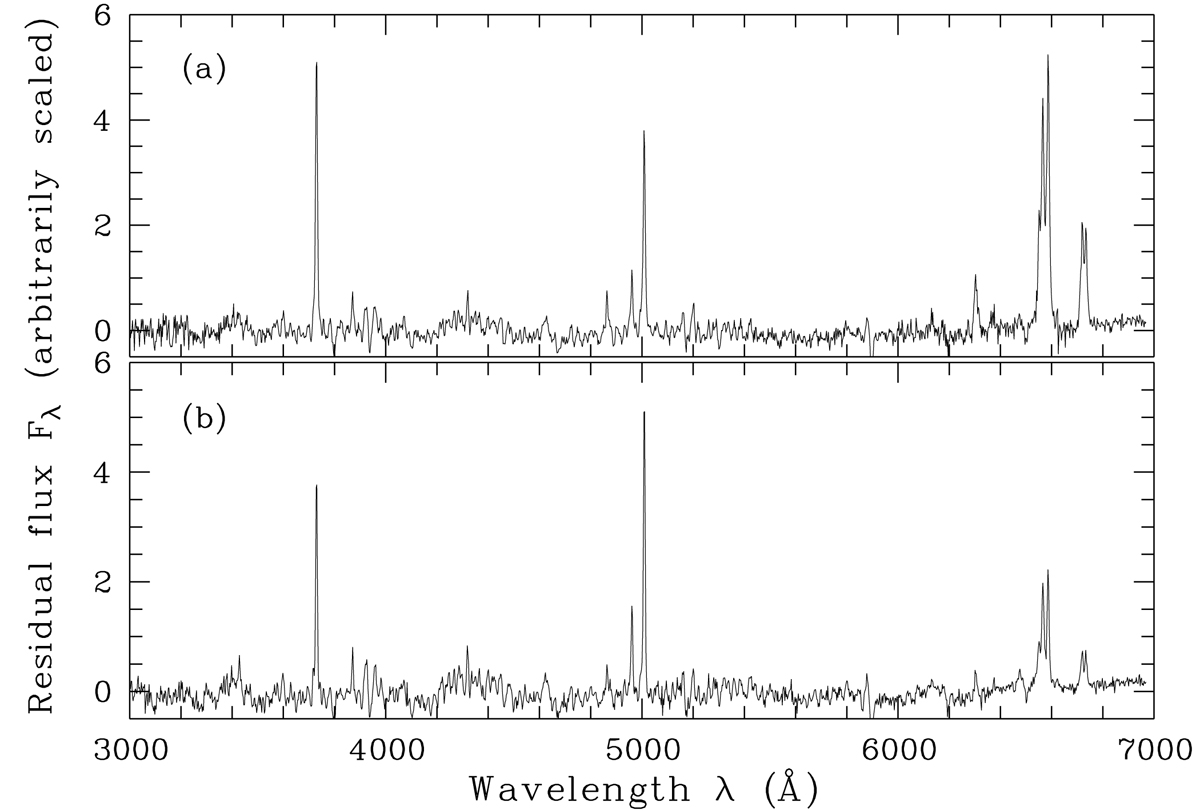
Residual spectra (composite minus model) for the PSS-CSO-G (a) and the ECS-G (b) subsample. The model spectra were arbitrarily scaled in such a way that the mean flux in the interval 4200–4800 Å is the same as in the corresponding observed composite spectrum.
Current usage metrics show cumulative count of Article Views (full-text article views including HTML views, PDF and ePub downloads, according to the available data) and Abstracts Views on Vision4Press platform.
Data correspond to usage on the plateform after 2015. The current usage metrics is available 48-96 hours after online publication and is updated daily on week days.
Initial download of the metrics may take a while.