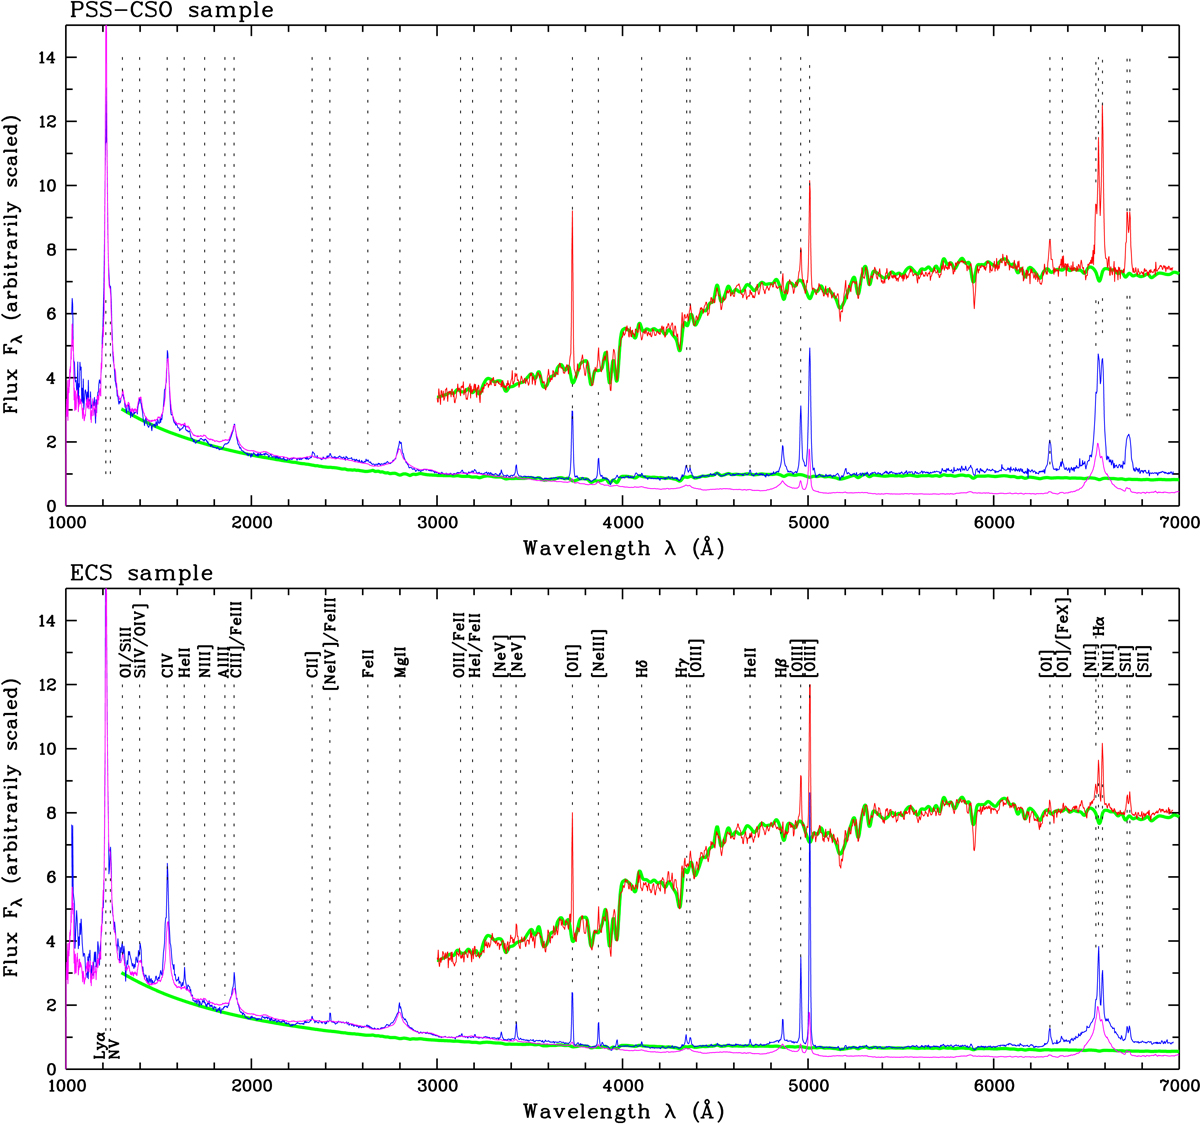
Fig. 7.
Download original image
Composite spectra for the PSS-CSO (top) and the ECS (bottom) sample. The QSO subsamples are shown in blue, the galaxy samples in red. The former were corrected for slight internal reddening using the SMC dust model to match the composite spectrum of the FBQS radio-loud quasars from Brotherton et al. (2001; magenta). The spectra for the galaxy subsamples were shifted upwards by 2.5 flux units for clarity. The green spectra are best-fit models for the continuum (see text). The positions of the strongest emission lines are indicated by dotted vertical lines and labelled by ion in the lower panel.
Current usage metrics show cumulative count of Article Views (full-text article views including HTML views, PDF and ePub downloads, according to the available data) and Abstracts Views on Vision4Press platform.
Data correspond to usage on the plateform after 2015. The current usage metrics is available 48-96 hours after online publication and is updated daily on week days.
Initial download of the metrics may take a while.