Open Access
Fig. 6.
Download original image
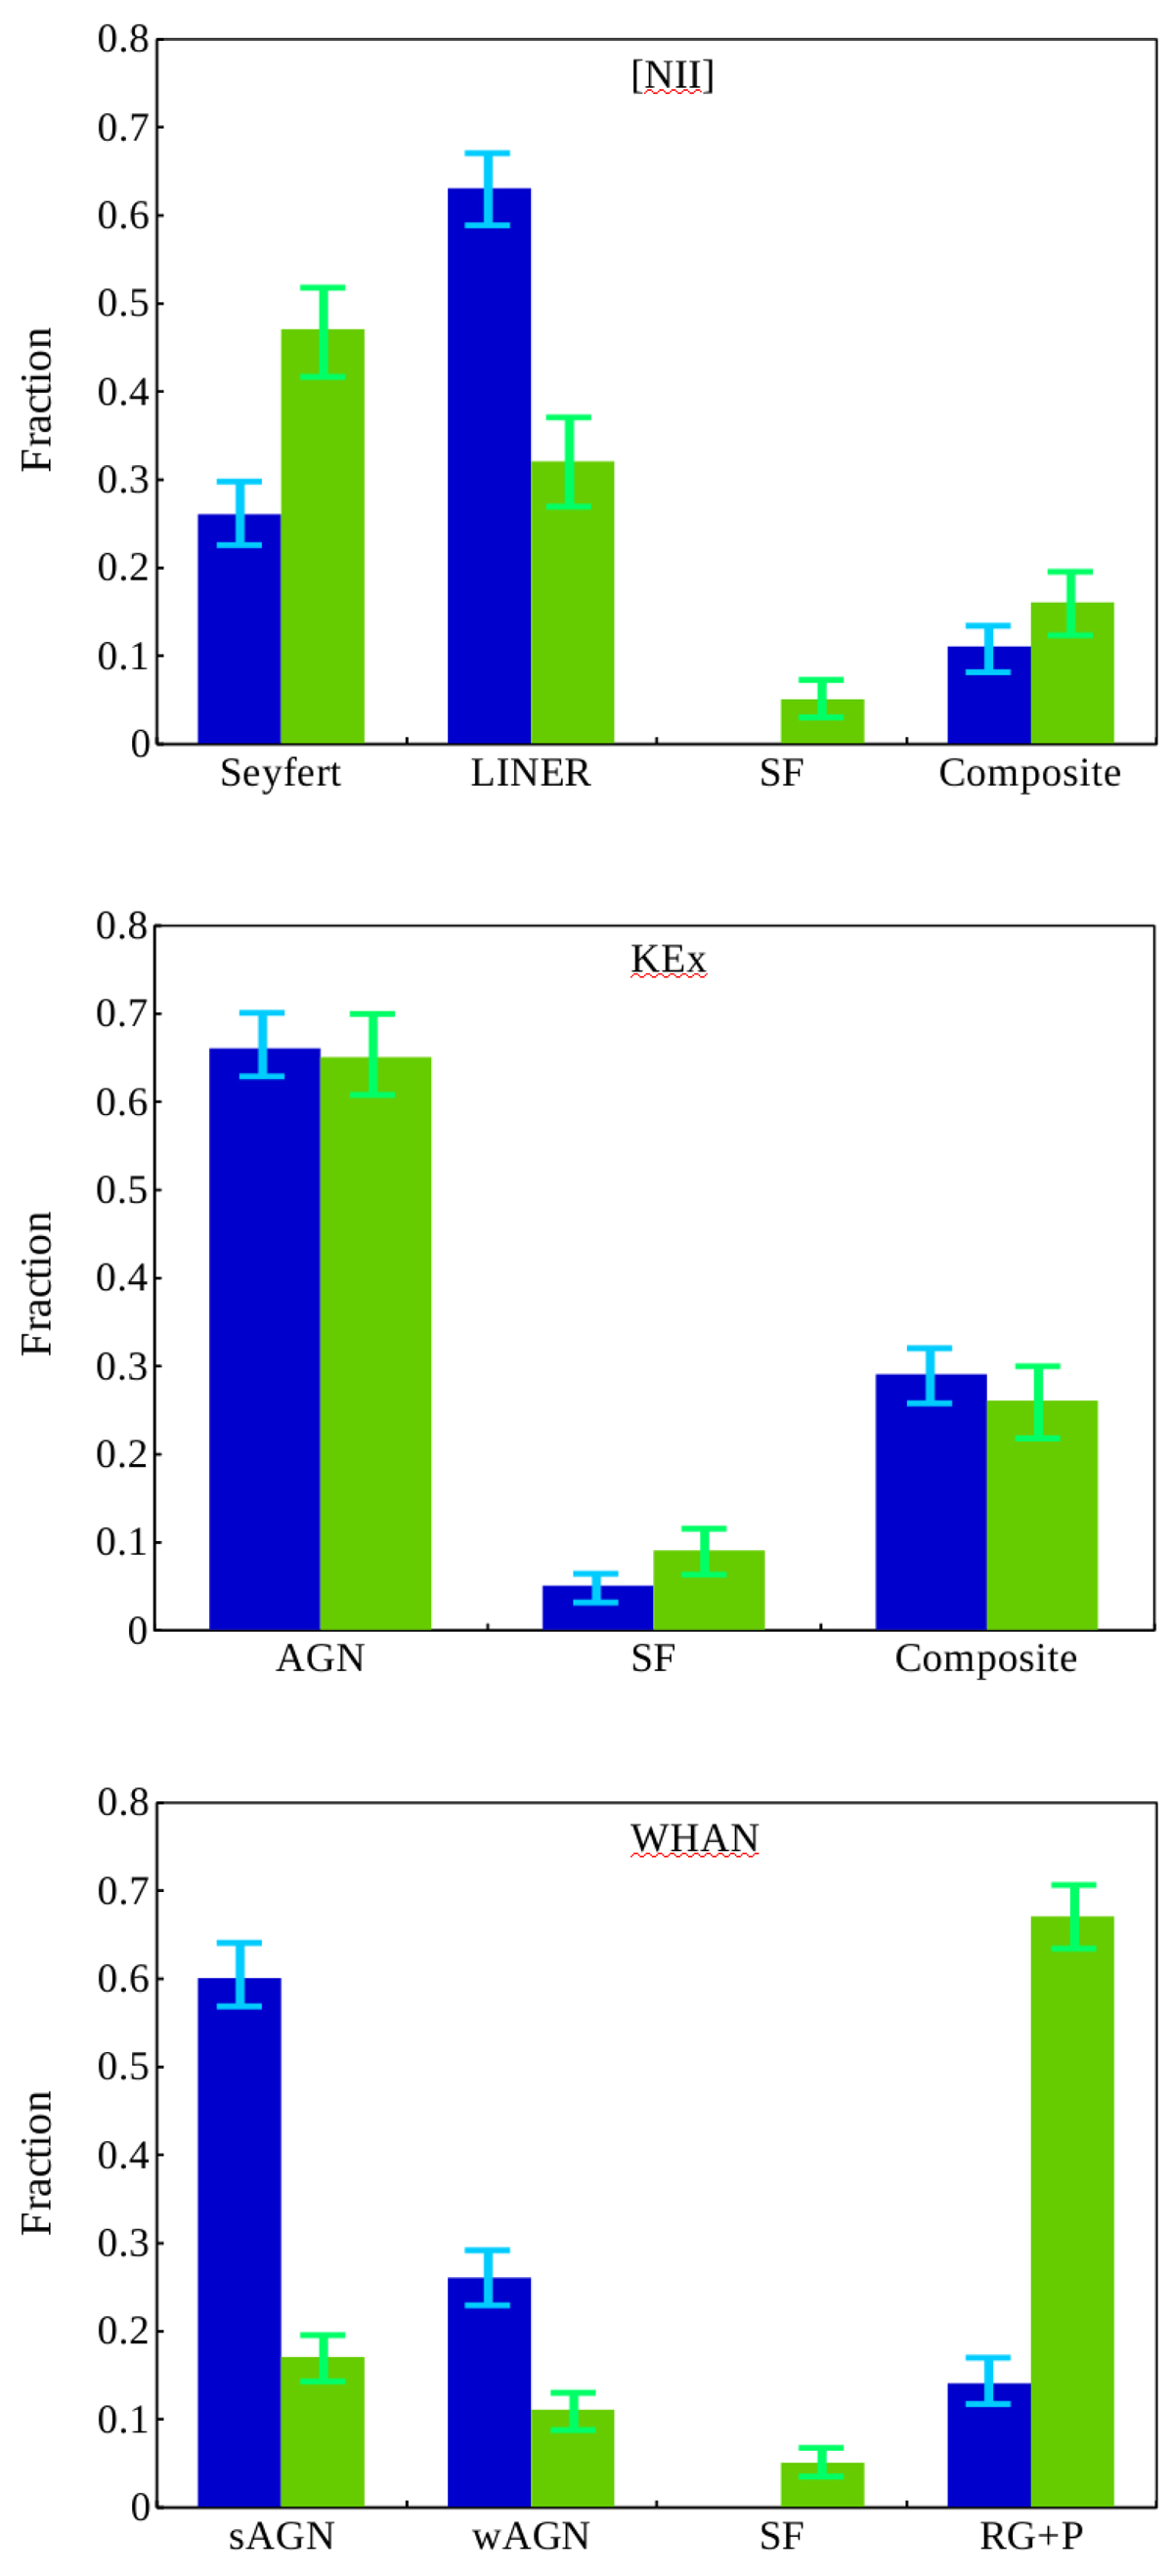
Distributions of the types from the diagnostic diagrams in Fig. 5 for the galaxies from the PSS-CSO (blue) and the ECS (green) samples: [N II]-based BPT diagram (top), KEx diagram (middle), and WHAN diagram (bottom). The vertical bars indicate the standard errors of the proportions.
Current usage metrics show cumulative count of Article Views (full-text article views including HTML views, PDF and ePub downloads, according to the available data) and Abstracts Views on Vision4Press platform.
Data correspond to usage on the plateform after 2015. The current usage metrics is available 48-96 hours after online publication and is updated daily on week days.
Initial download of the metrics may take a while.