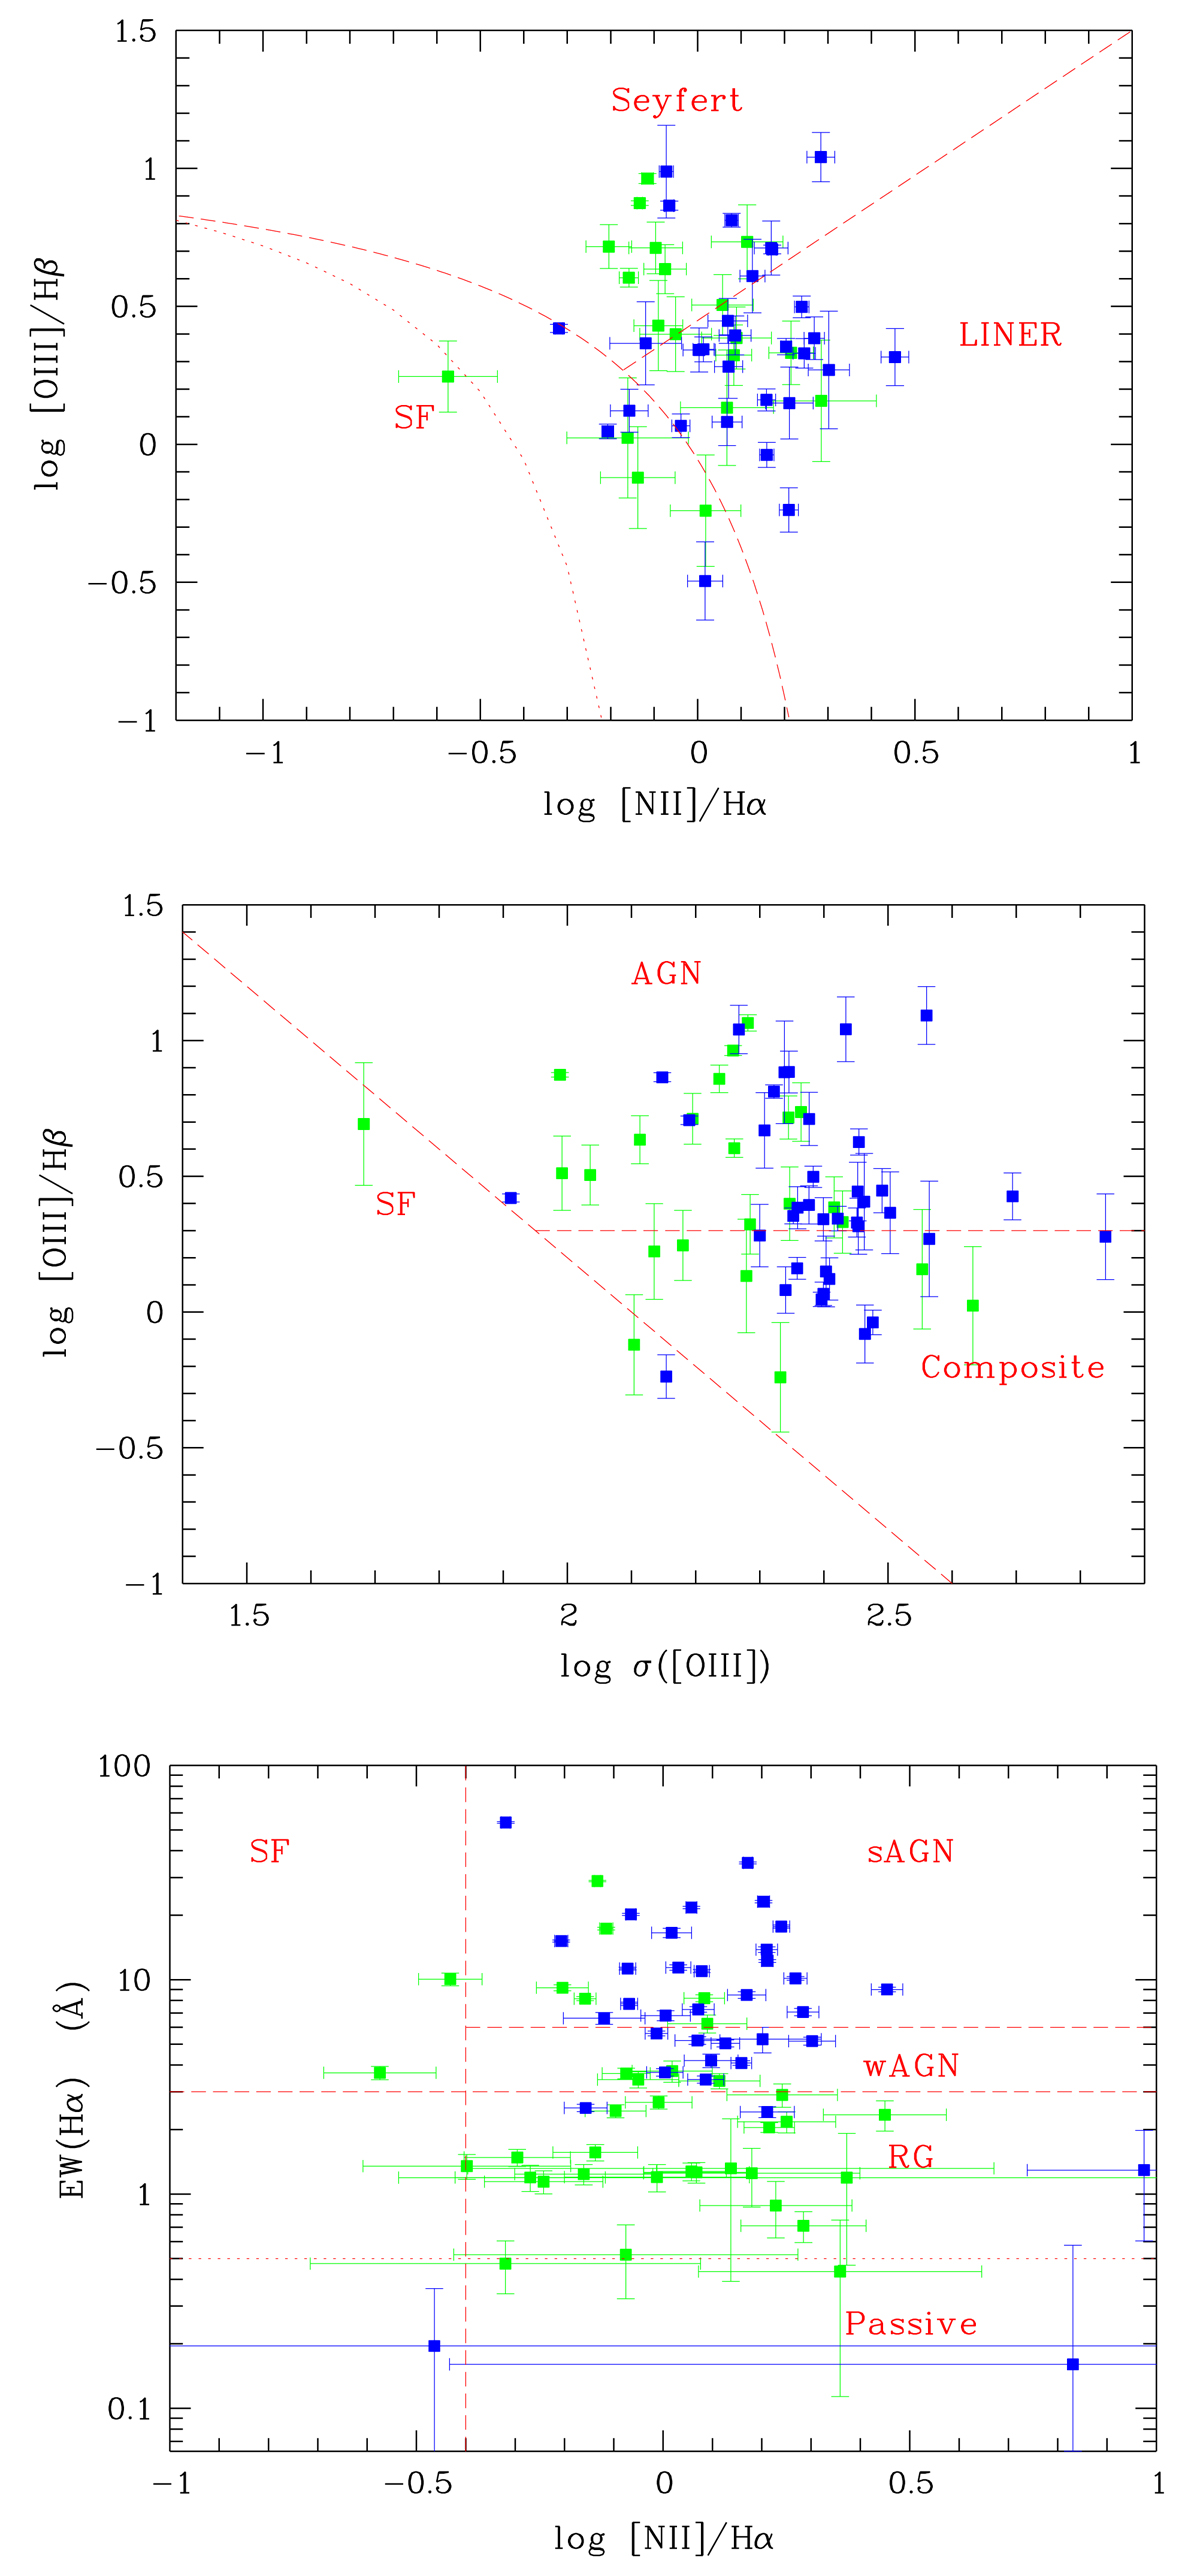
Fig. 5.
Download original image
Diagnostic diagrams for the galaxies (SDSS spectral class = GALAXY) from the PSS-CSO (blue) and the ECS (green) samples with S/N ≥ 3 for used lines. Top: [N II] based BPT diagram for z < 0.35 with the upper limit for SF galaxies from Kewley et al. (2006; dashed), the lower limit for AGNs from Kauffmann et al. (2003a; dotted), and the separation between AGNs and LINERs from Schawinski et al. (2007; dashed). Middle: KEx diagram with demarcation lines from Zhang & Hao (2018). Bottom: WHAN diagram with demarcation lines from Cid Fernandes et al. (2011).
Current usage metrics show cumulative count of Article Views (full-text article views including HTML views, PDF and ePub downloads, according to the available data) and Abstracts Views on Vision4Press platform.
Data correspond to usage on the plateform after 2015. The current usage metrics is available 48-96 hours after online publication and is updated daily on week days.
Initial download of the metrics may take a while.