Open Access
Fig. 4.
Download original image
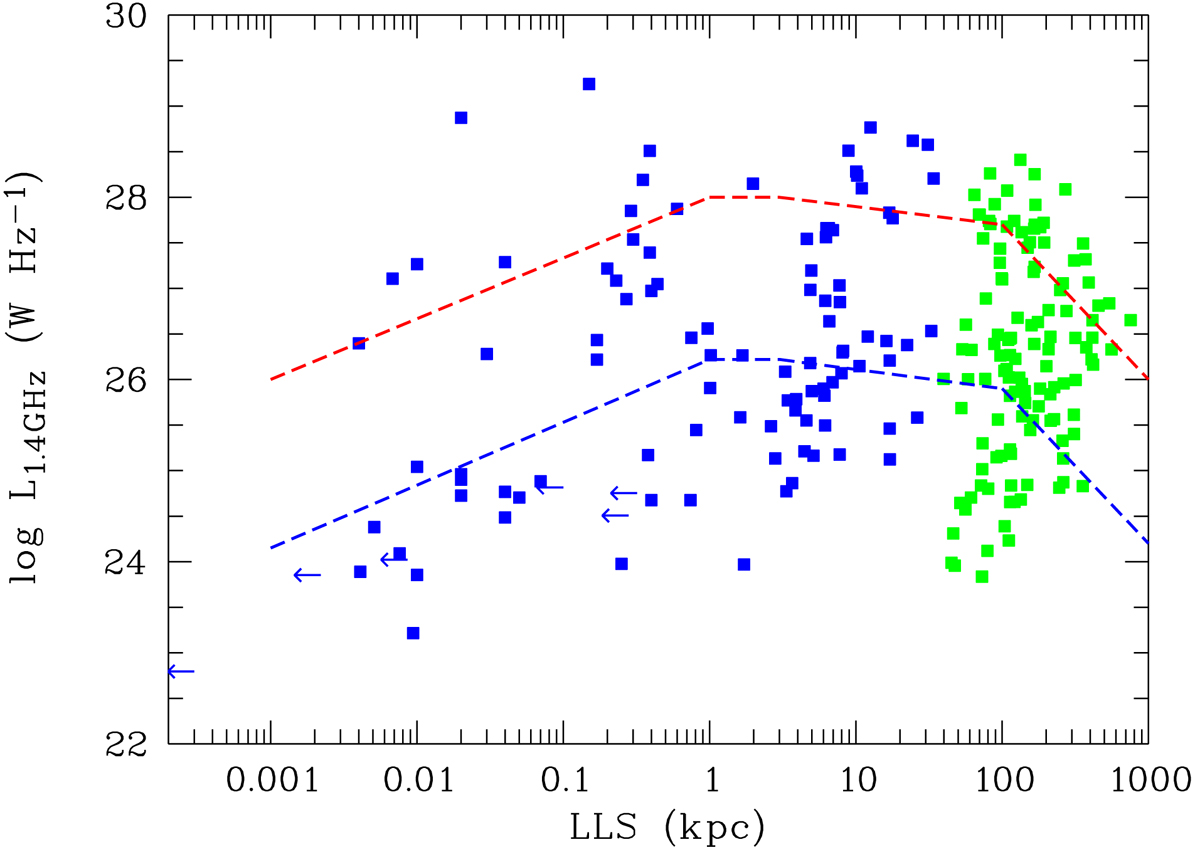
Power – linear size diagram for the PSS-CSO (blue) and the ECS (green) samples. Left arrows indicate upper limits for the LLS. For the PSS-CSO sample, the sizes are taken from Liao & Gu (2020). The dashed lines depict evolutionary tracks from An & Baan (2012) for sources of high radio-power (red) and low radio-power (blue).
Current usage metrics show cumulative count of Article Views (full-text article views including HTML views, PDF and ePub downloads, according to the available data) and Abstracts Views on Vision4Press platform.
Data correspond to usage on the plateform after 2015. The current usage metrics is available 48-96 hours after online publication and is updated daily on week days.
Initial download of the metrics may take a while.