Fig. 2.
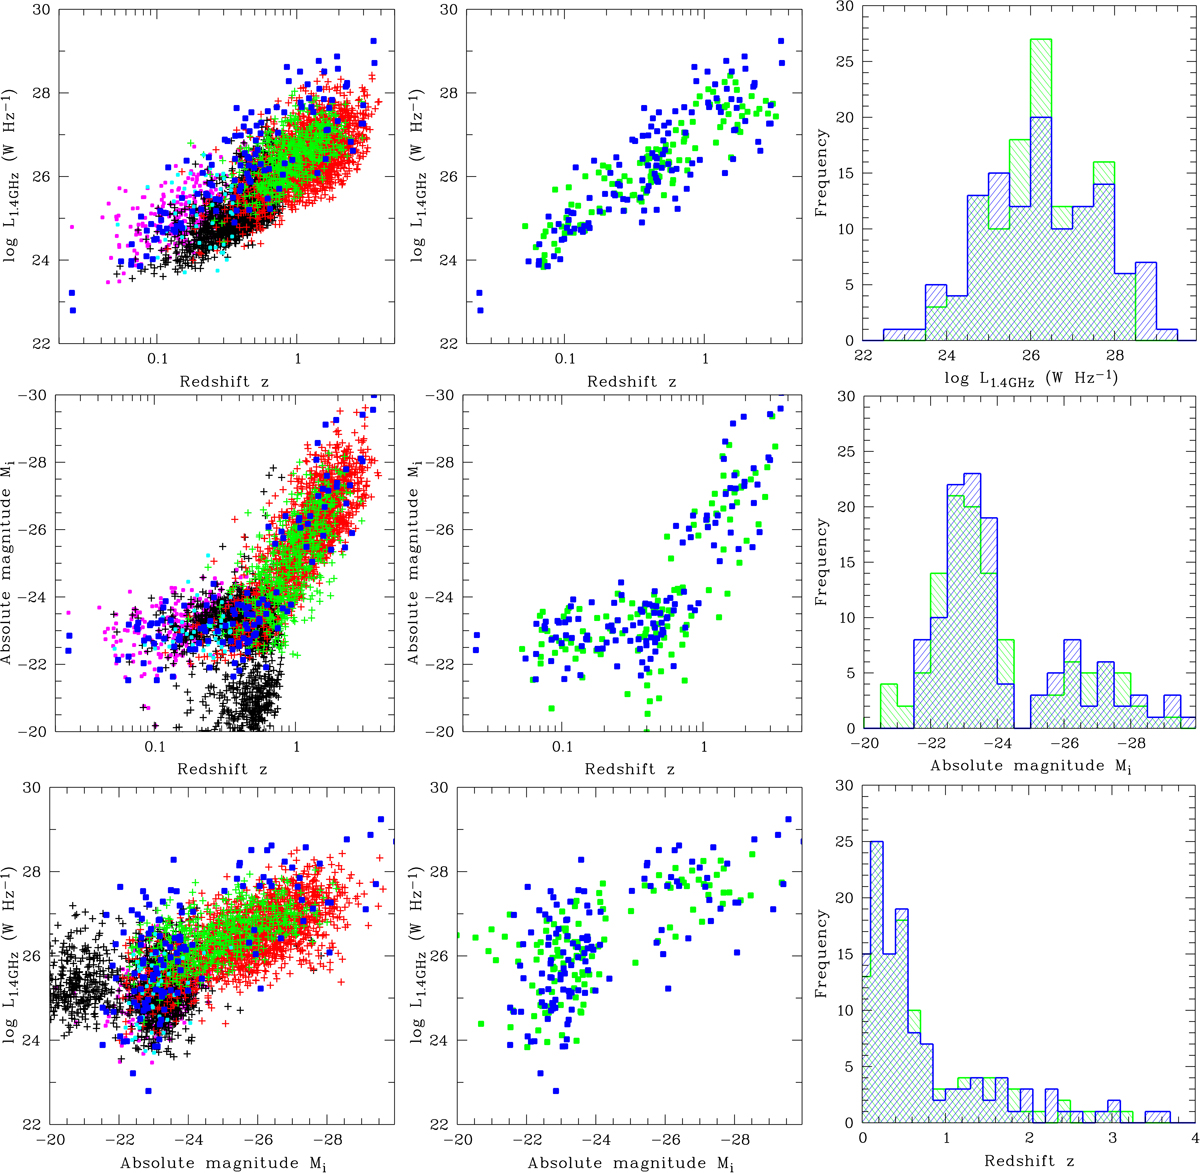
Download original image
Comparison of the PSSs and CSOs with extended radio galaxies and quasars in the z − L1.4 GHz − Mi parameter space. Left and middle columns: Projections of the distributions of the PSS-CSO sample (blue filled squares) and the extended comparison galaxies and quasars. The panels on the left-hand side show the different contributions to the basic sample from which the comparison sample is drawn (small symbols: red plus signs – Shen et al. 2011, black plus signs – Garon et al. 2019, cyan filled squares – Rafter et al. 2011, green plus signs – Kuźmicz & Jamrozy 2021, magenta filled squares – Kozieł-Wierzbowska & Stasińska 2011). In the middle column, the final ECS sample (green) is compared with the PSS-CSO sample (blue). Right column: histogram distributions of the PSSs and CSOs (blue) and the ECSs (green).
Current usage metrics show cumulative count of Article Views (full-text article views including HTML views, PDF and ePub downloads, according to the available data) and Abstracts Views on Vision4Press platform.
Data correspond to usage on the plateform after 2015. The current usage metrics is available 48-96 hours after online publication and is updated daily on week days.
Initial download of the metrics may take a while.