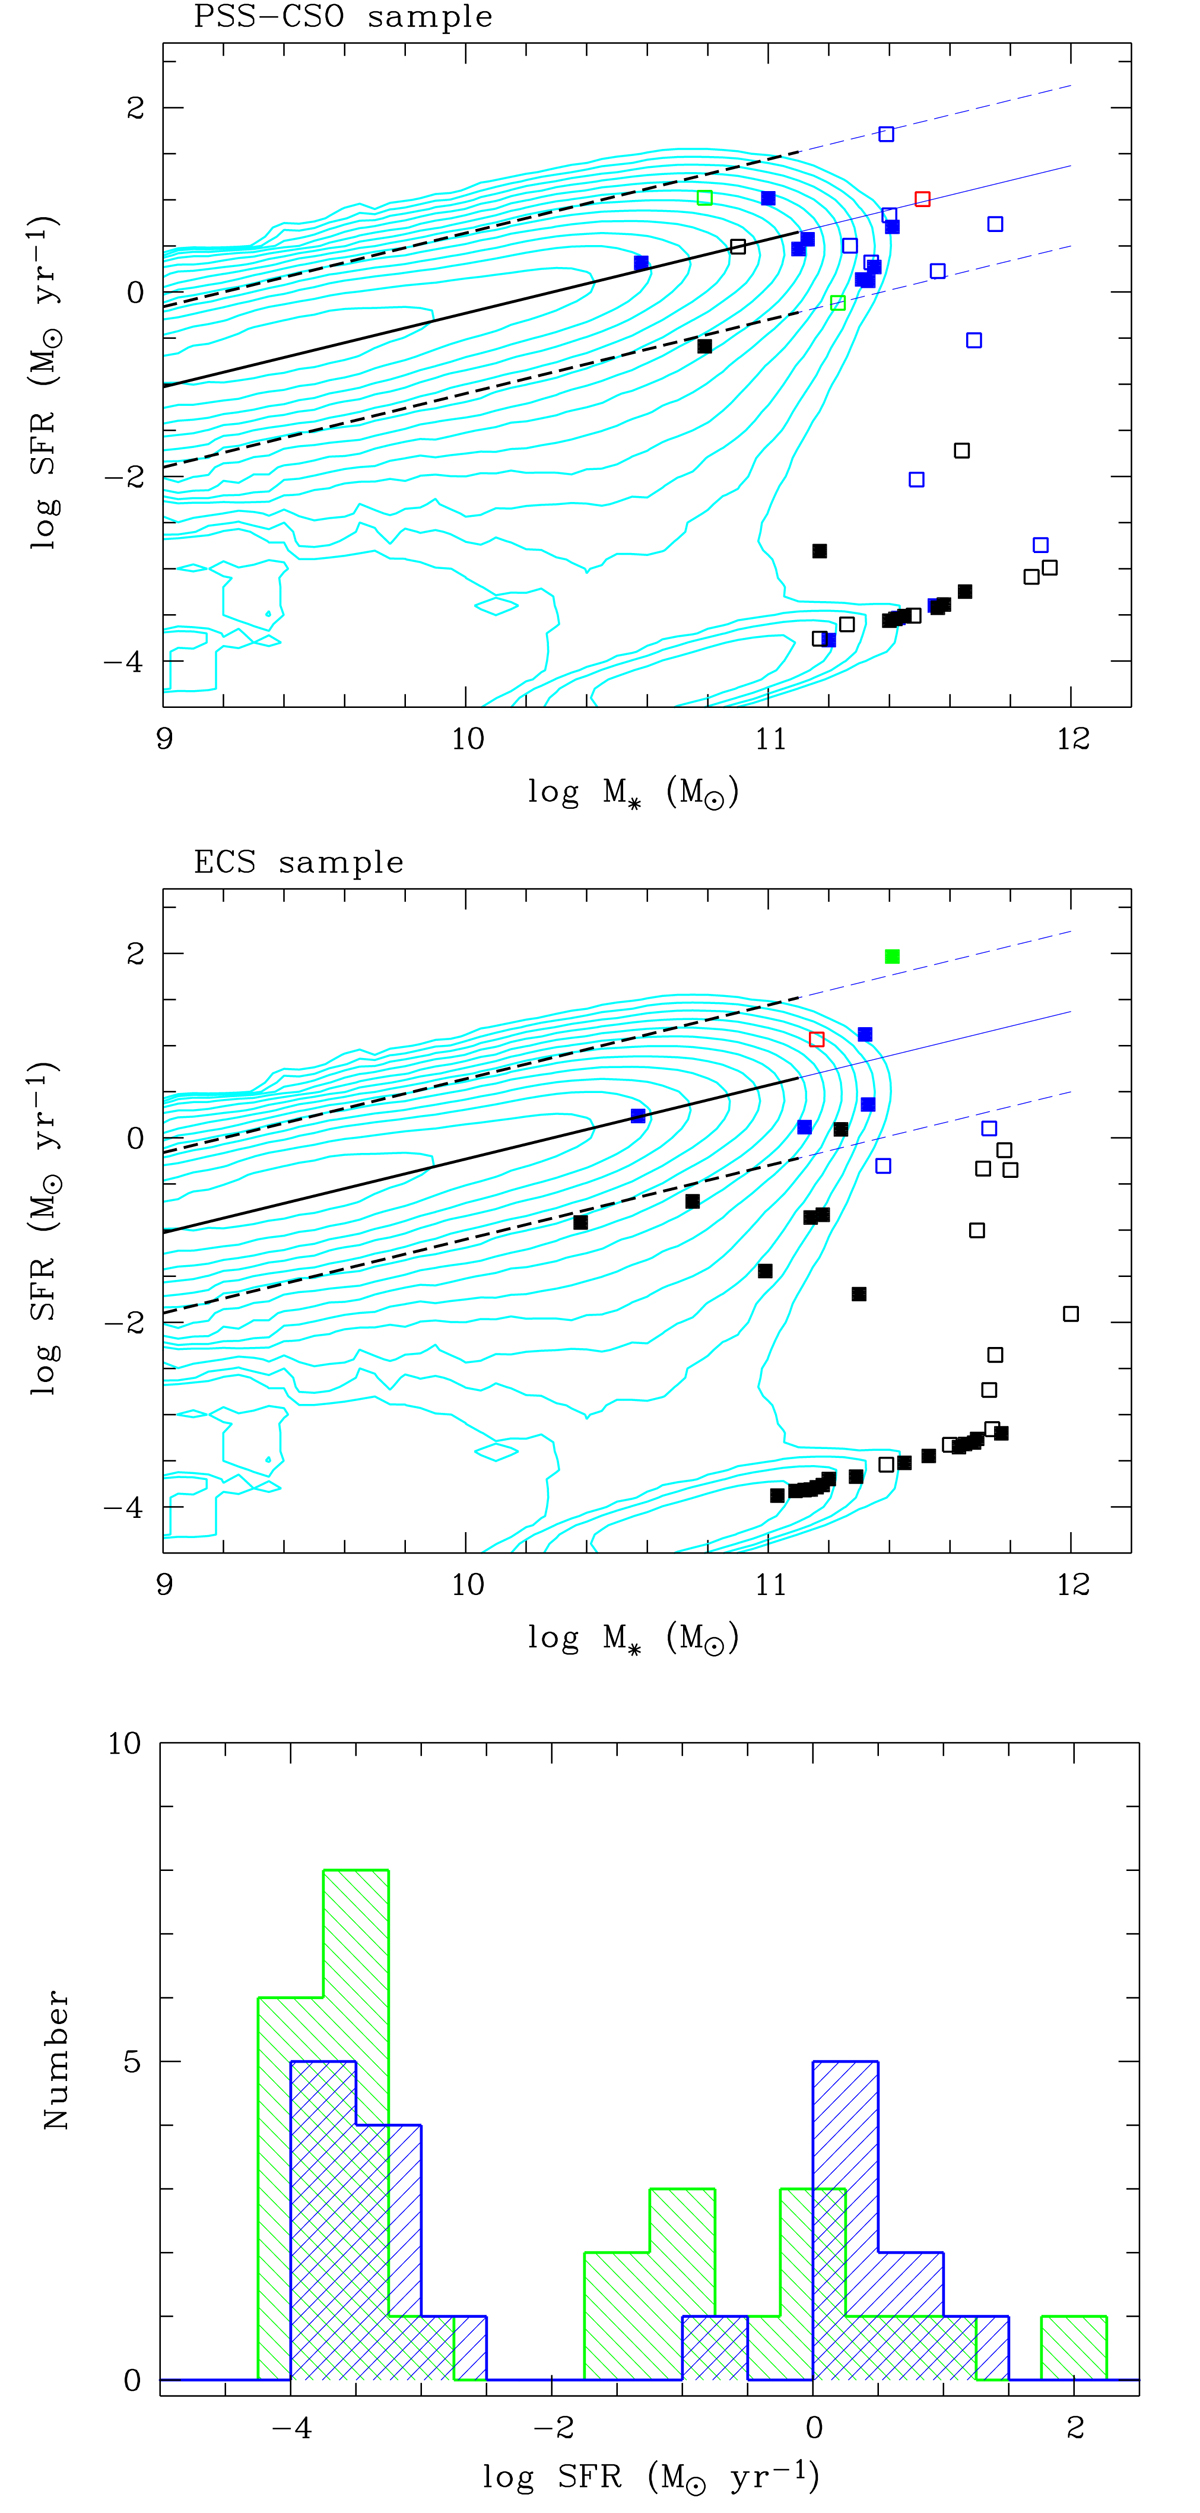
Fig. 15.
Download original image
Stellar mass and SFR. Top and middle: SFR versus stellar mass from Chang et al. (2015) for the PSS-CSO and the ECS samples. The colour coding of the symbols is the same as in Fig. 14, filled squares signify galaxies with good model fits. The cyan curves are local density contours maps for ∼9 × 10⁴ SDSS galaxies. The black lines indicate the SF sequence (solid) and the 3σ scatter (dashed), the blue lines are the corresponding extrapolations to log M*/M⊙ = 12. Bottom: Histogram distributions of the SFR for the PSS-CSO (blue) and ECS (green) galaxies with FLAG = 1.
Current usage metrics show cumulative count of Article Views (full-text article views including HTML views, PDF and ePub downloads, according to the available data) and Abstracts Views on Vision4Press platform.
Data correspond to usage on the plateform after 2015. The current usage metrics is available 48-96 hours after online publication and is updated daily on week days.
Initial download of the metrics may take a while.