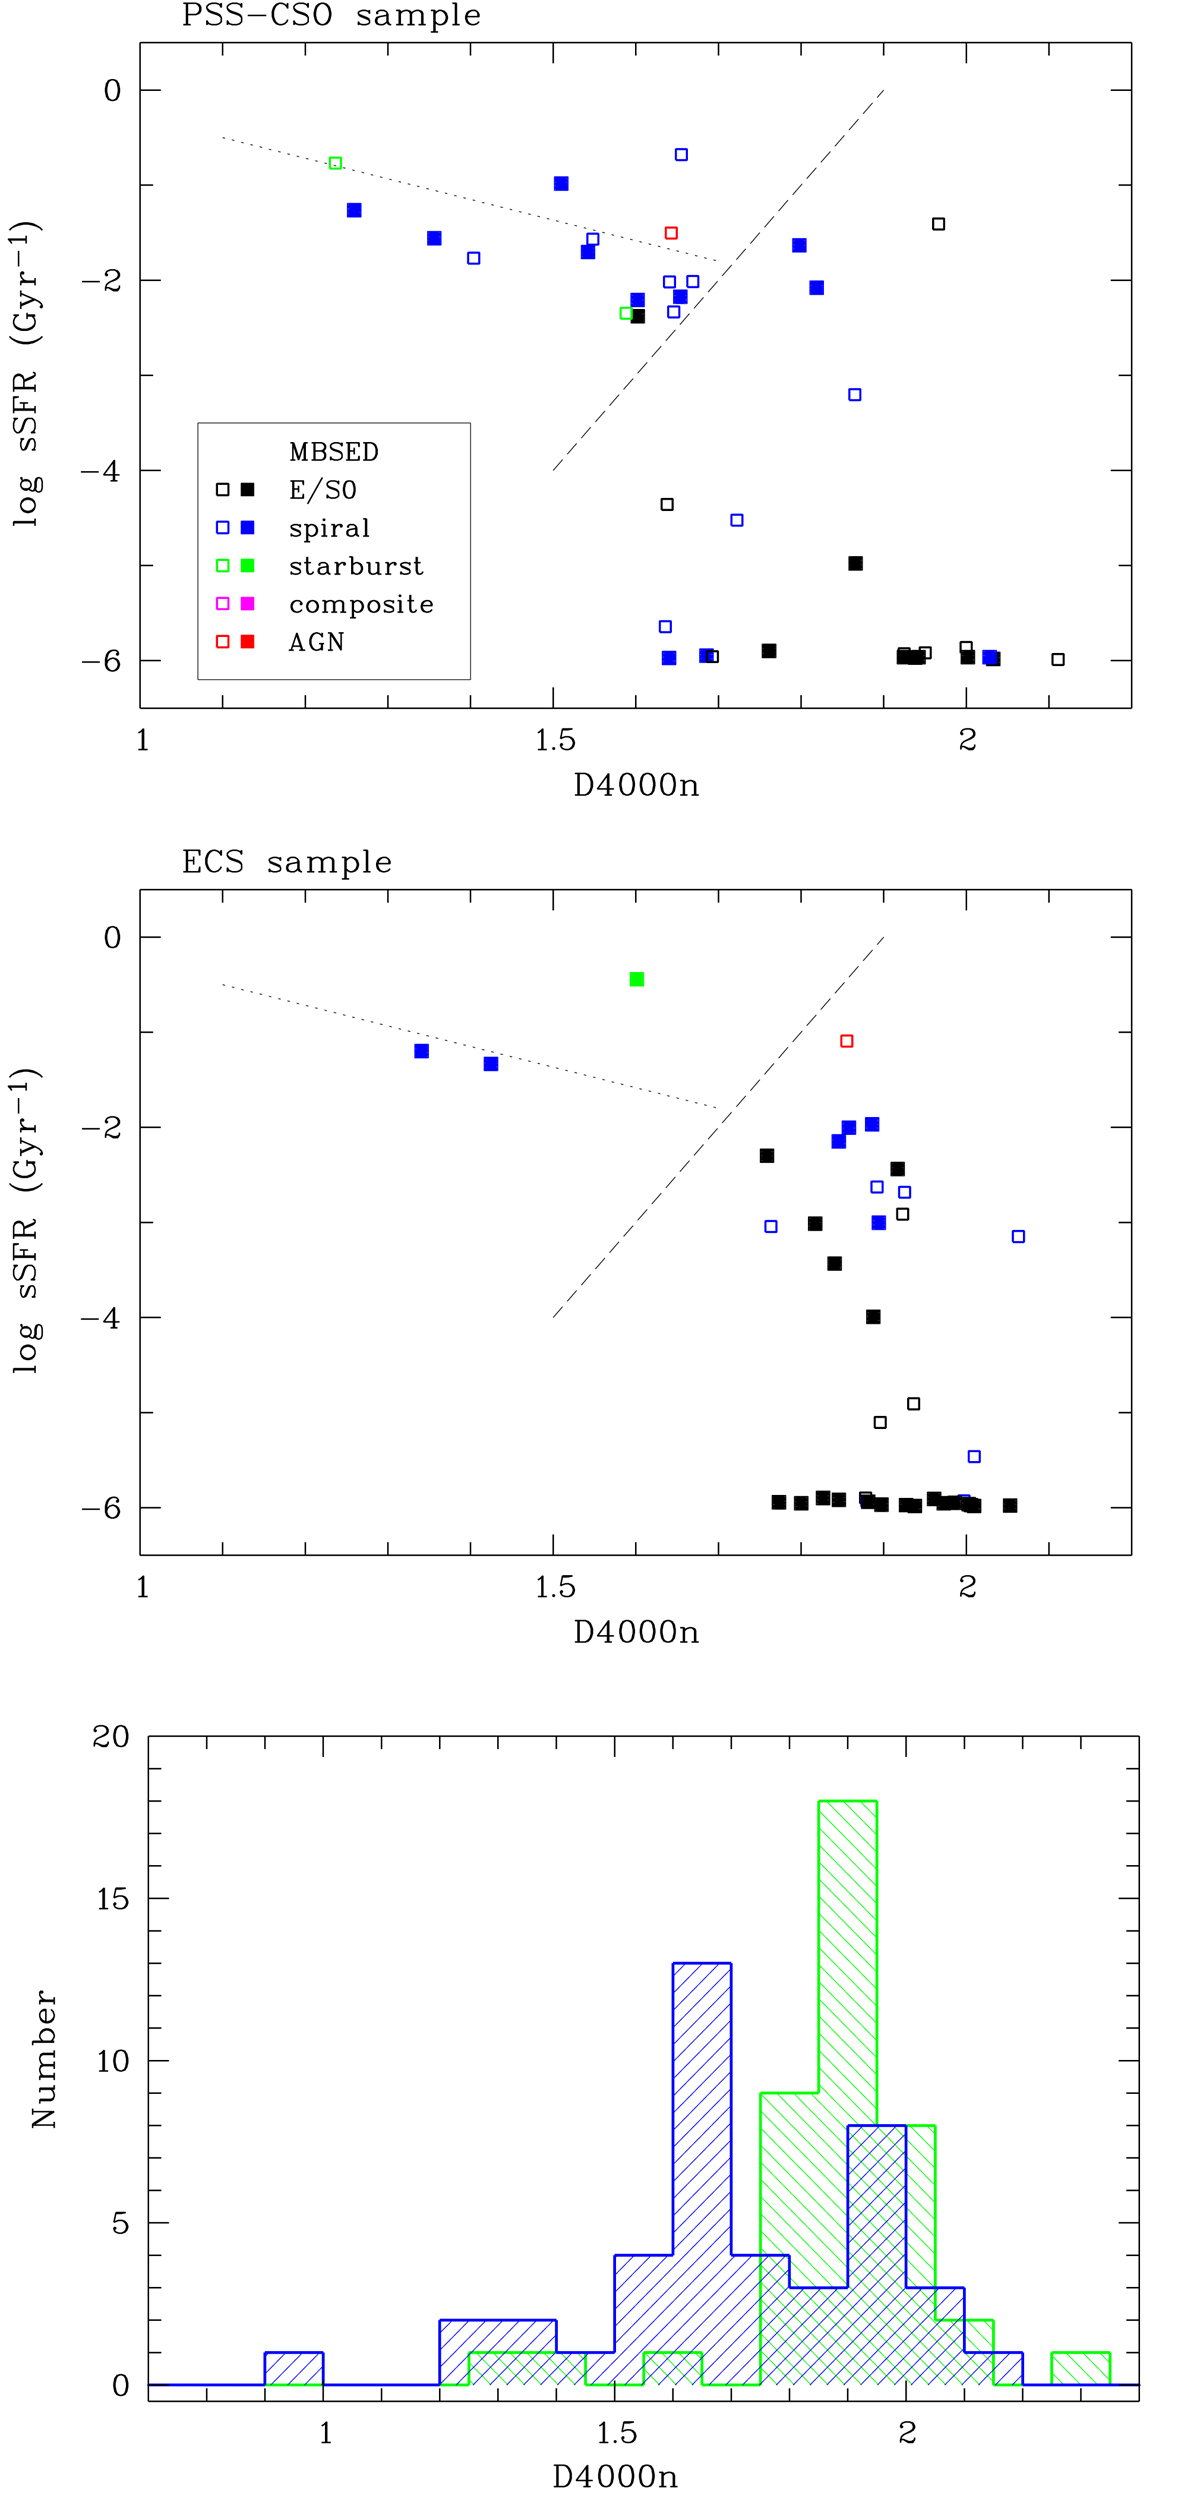
Fig. 14.
Download original image
D4000n index and sSFR. Top and middle: sSFR from Chang et al. (2015) versus D4000n for the PSS-CSO and the ECS samples. Filled squares signify sSFR data from good model fits (FLAG = 1). The dashed line indicates the boundary between the SF sequence (above) and passive galaxies (below). The dotted line is a power-law approximation of the mean values from Brinchmann et al. (2004, their Fig. 11). The spectral types tSED from the MBSED fit are colour coded as in Fig. 12. Bottom: Histogram distributions of the D4000n index for the PSS-CSO (blue) and ECS (green) galaxies with S/N > 3.
Current usage metrics show cumulative count of Article Views (full-text article views including HTML views, PDF and ePub downloads, according to the available data) and Abstracts Views on Vision4Press platform.
Data correspond to usage on the plateform after 2015. The current usage metrics is available 48-96 hours after online publication and is updated daily on week days.
Initial download of the metrics may take a while.