Fig. 12.
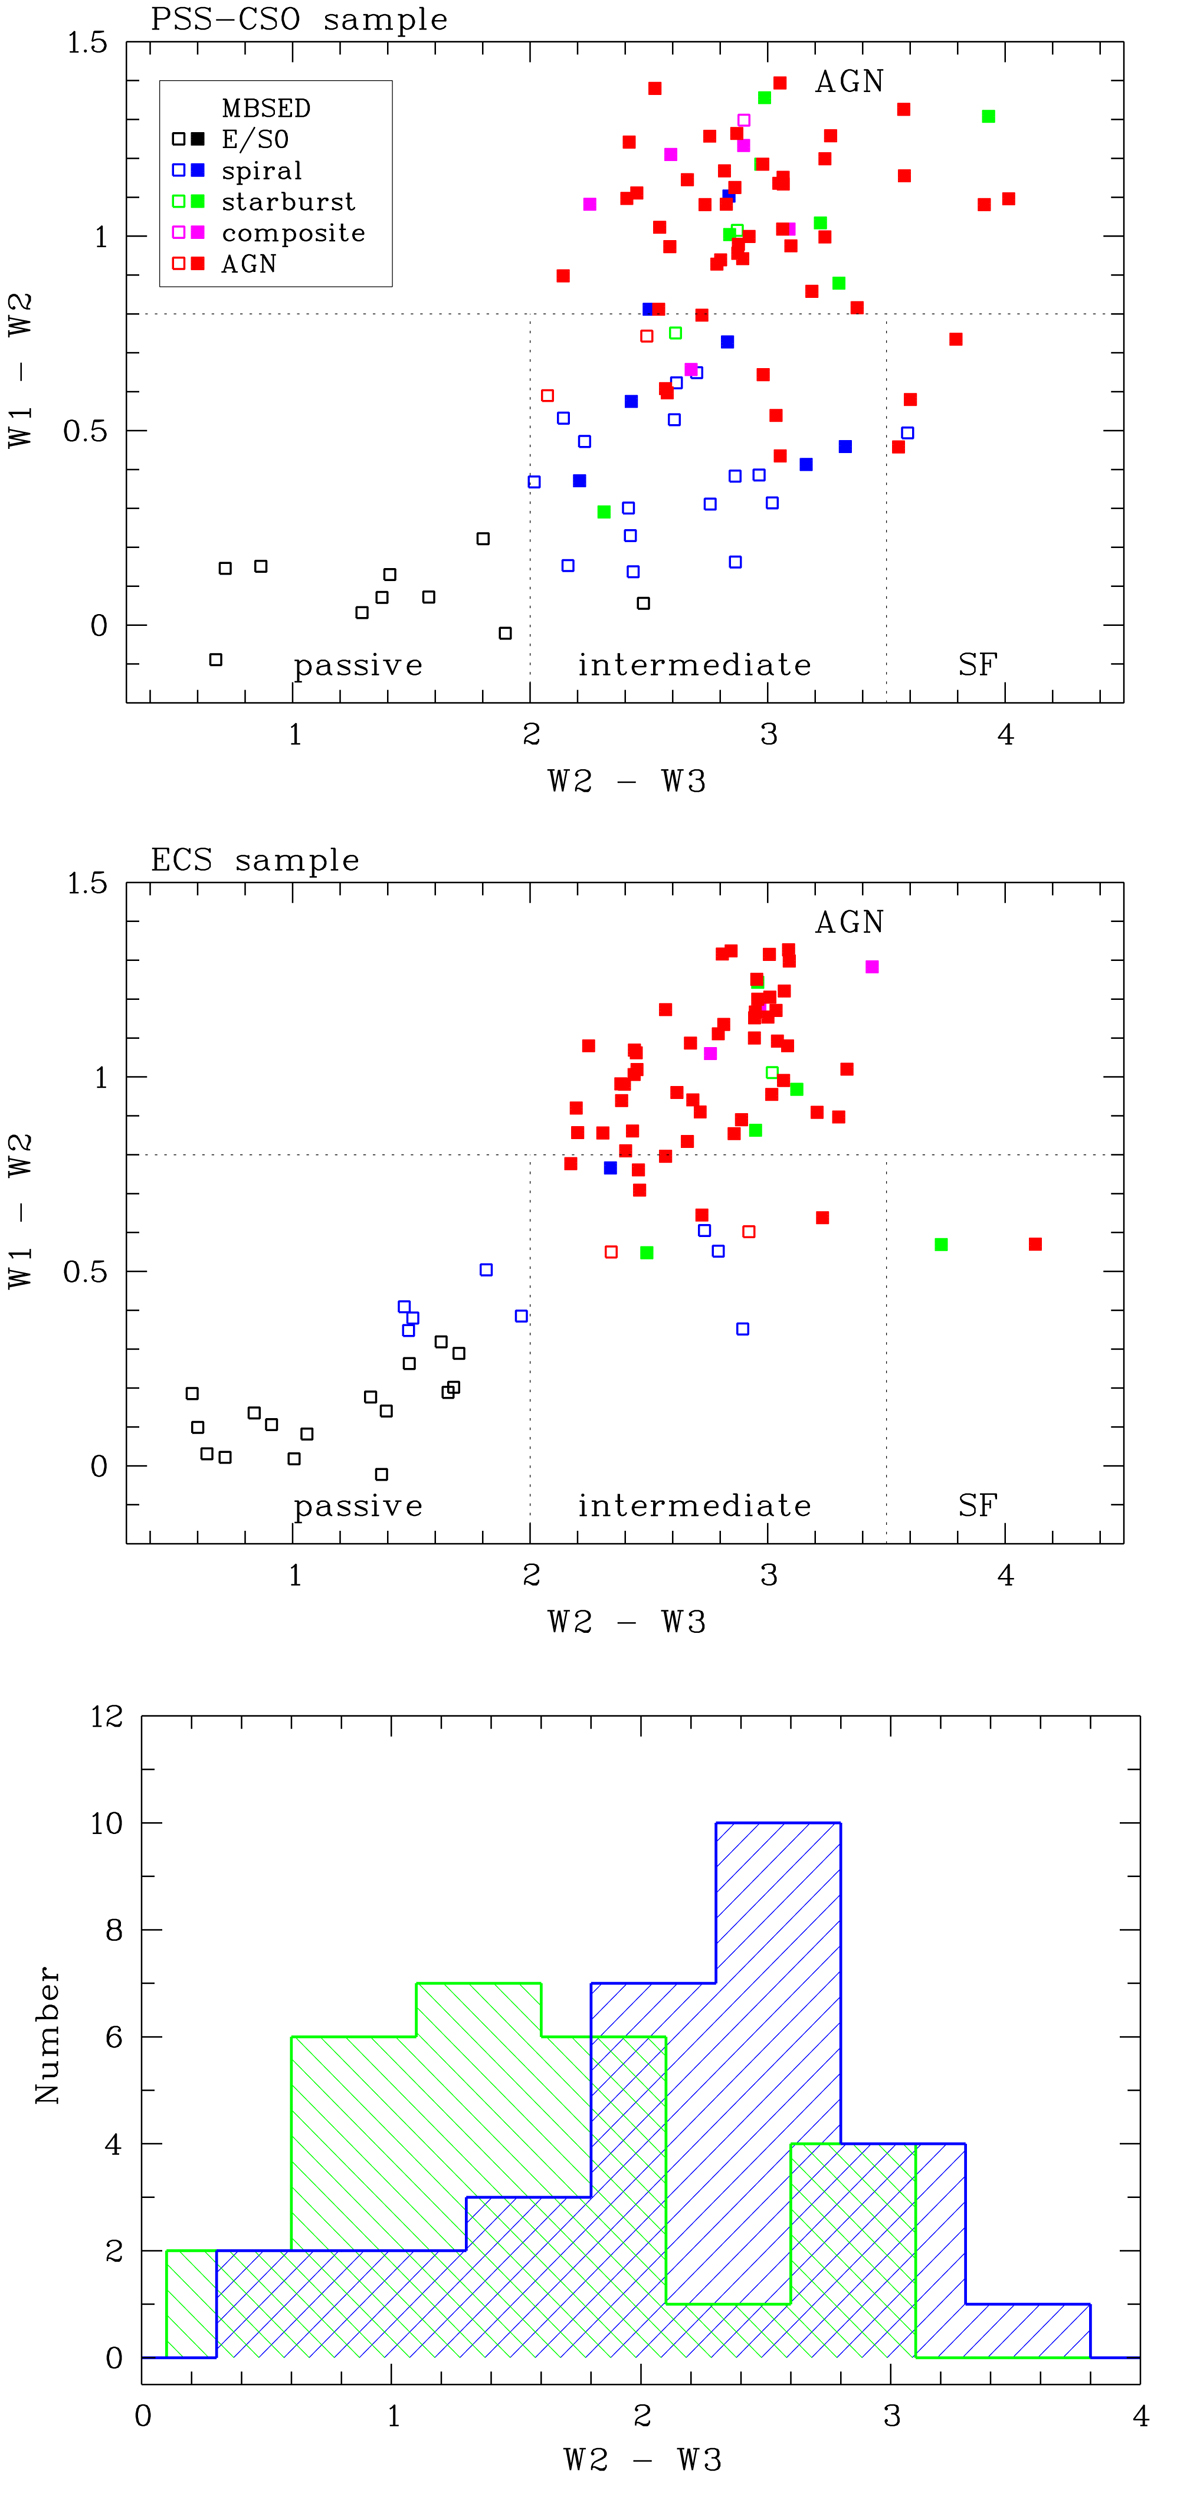
Download original image
WISE W1 − W2 vs. W2 − W3 diagram for the PSS-CSO (top) and the ECS (middle) sample. The symbols and colours have the same meaning as in Fig. 11. The dotted vertical demarcation lines are from Jarrett et al. (2017), the horizontal line marks the AGN threshold from Stern et al. (2012). Bottom: Histogram distributions of W2 − W3 for the PSS-CSO-G (blue) and ECS-G (green) galaxies with W1 − W2 < 0.8. Only sources with S/N > 5 in the bands W1 and W2 and with S/N > 3 in the band W3 are plotted.
Current usage metrics show cumulative count of Article Views (full-text article views including HTML views, PDF and ePub downloads, according to the available data) and Abstracts Views on Vision4Press platform.
Data correspond to usage on the plateform after 2015. The current usage metrics is available 48-96 hours after online publication and is updated daily on week days.
Initial download of the metrics may take a while.