Fig. 11.
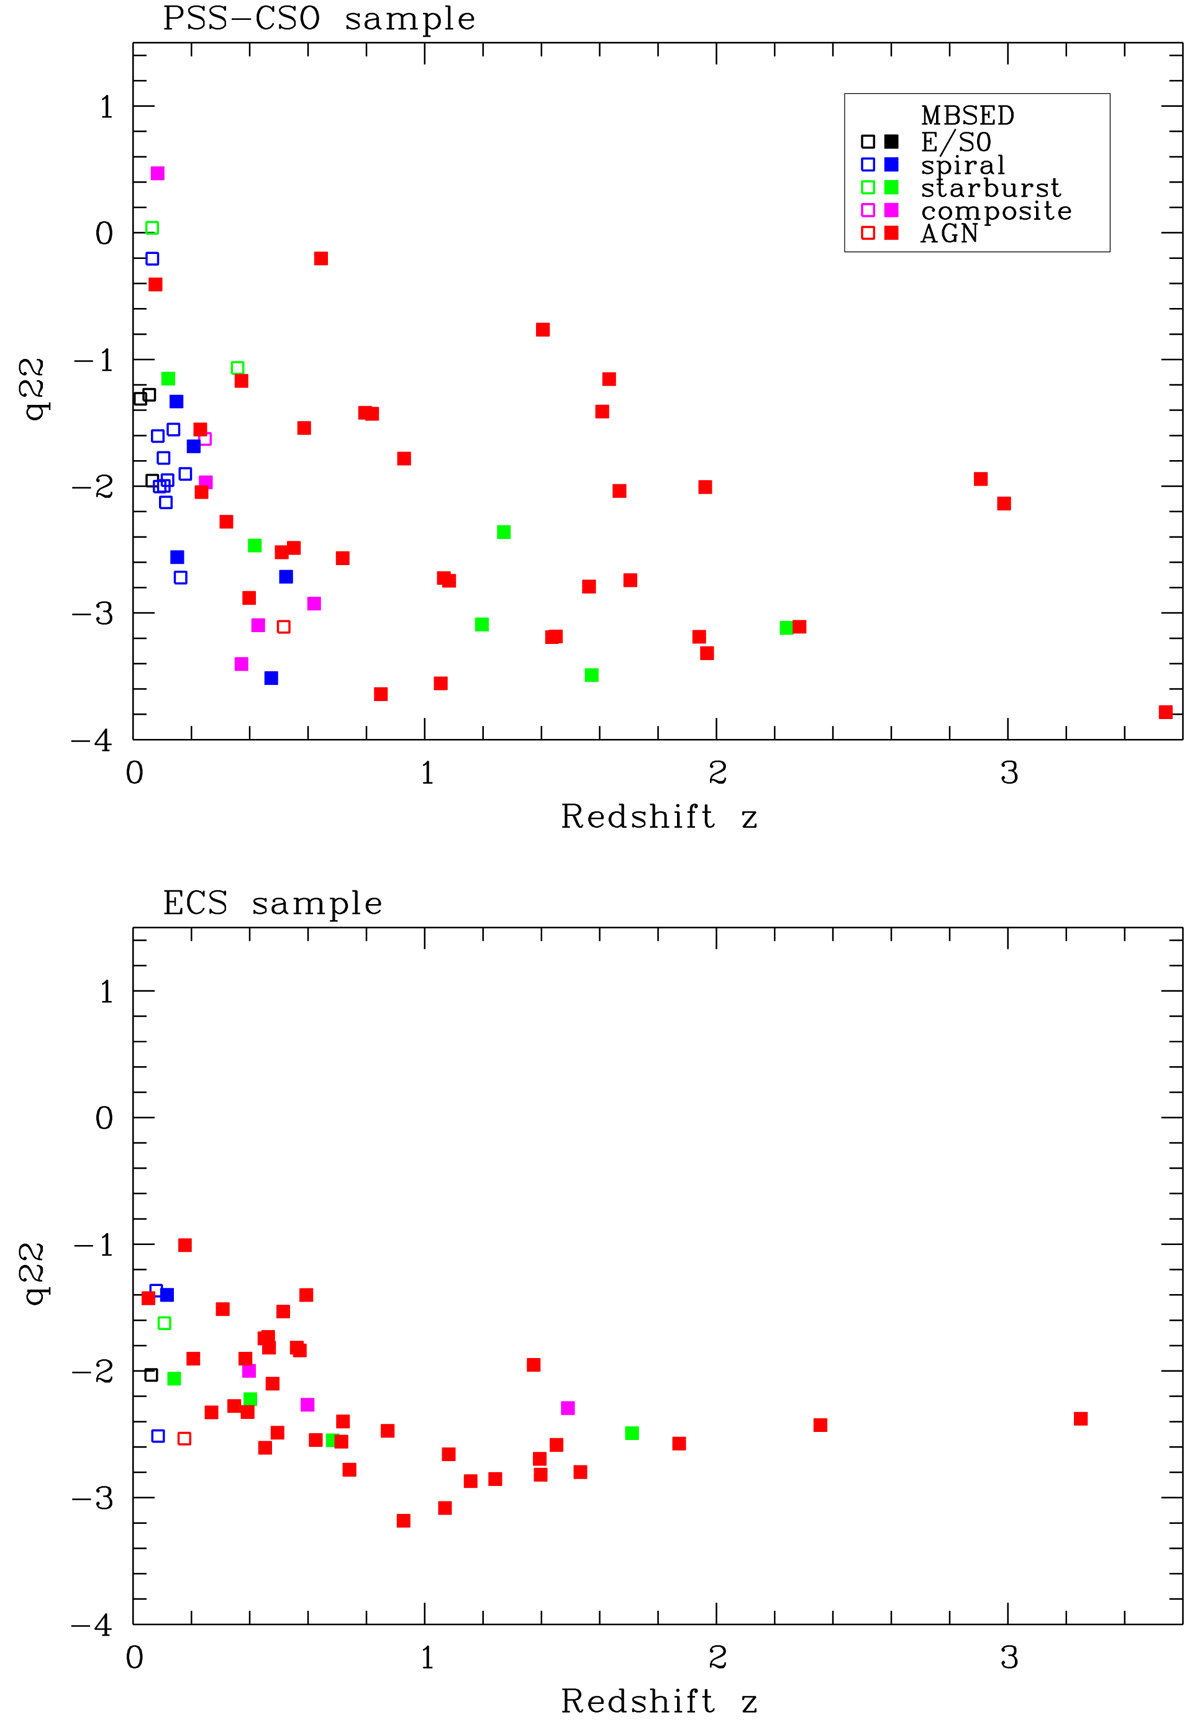
Download original image
MIR-to-radio flux density ratio q22 vs. redshift for the PSS-CSO (top) and the ECS (bottom) sample; only sources with reliable type classification from the MBSED fitting and with S/N > 3 for the W4 flux density are plotted. Filled squares stand for the QSO subsample, open squares for the G subsample. The colours indicate types from MBSED fitting (see inset).
Current usage metrics show cumulative count of Article Views (full-text article views including HTML views, PDF and ePub downloads, according to the available data) and Abstracts Views on Vision4Press platform.
Data correspond to usage on the plateform after 2015. The current usage metrics is available 48-96 hours after online publication and is updated daily on week days.
Initial download of the metrics may take a while.