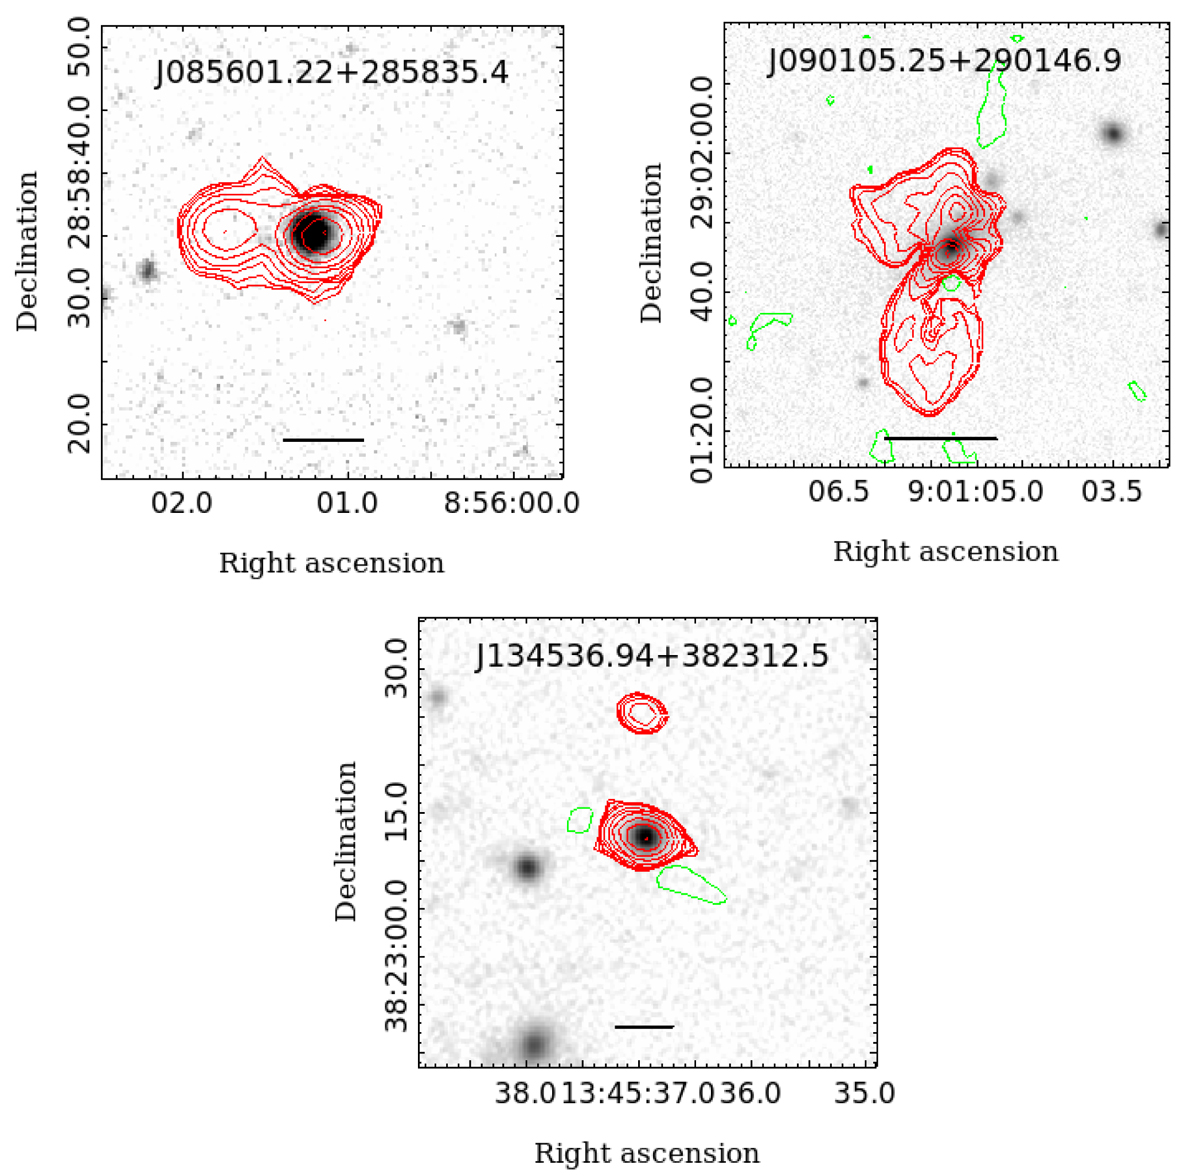
Fig. 1.
Download original image
VLASS contours of the three sources from the Liao & Gu (2020) sample with VLASS sizes larger than 50 kpc. The ten red contour lines are logarithmically spaced between ∼5σ of the local noise and the maximum flux of the source. The green dashed lines are negative contours at −5σ to −3σ. The background images are from the SDSS i band. The vertical bar at the bottom indicates a length of 50 kpc at the redshift of the source.
Current usage metrics show cumulative count of Article Views (full-text article views including HTML views, PDF and ePub downloads, according to the available data) and Abstracts Views on Vision4Press platform.
Data correspond to usage on the plateform after 2015. The current usage metrics is available 48-96 hours after online publication and is updated daily on week days.
Initial download of the metrics may take a while.