Fig. 2.
Download original image
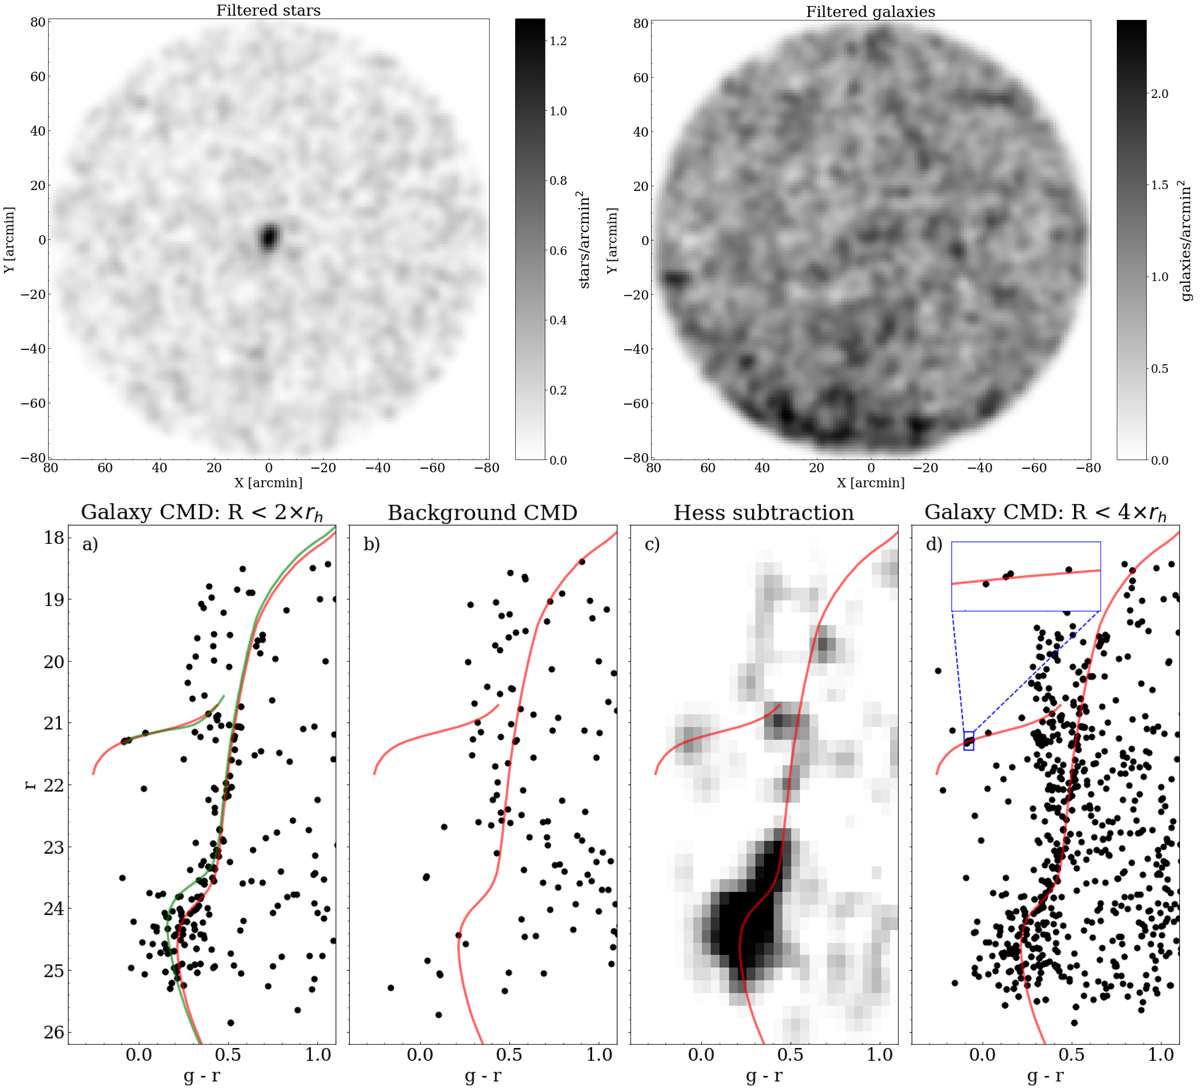
Top row: density map of stars included in the HSC-SSP catalog, and filtered by an isochrone characterised by log(t/yr) = 10.12 dex; [Fe/H] ∼ −2.2 dex, and m − M = 20.8 mag (left). The depicted region encompasses 80′ in radius centered on the dwarf galaxy. The figure has been smoothed with a Gaussian kernel with bandwidth = 2′. Density map of sources included in the HSC-SSP catalog and classified as galaxies, filtered by the same isochrone parameters adopted for the stars (right). Bottom row: CMD of the stars located within 2 × rh from the galaxy center (panel a). A red (green) isochrone with log(t/yr) = 10.00 (log(t/yr) = 10.12); [Fe/H] ∼ −2.2 dex, and m − M = 20.8 mag is overlaid to the figure. CMD of stars within a local field of the same area as that used to construct the CMD in the panel to the left (panel b). Hess diagram obtained by subtracting the CMDs displayed in panels a and b (panel c). CMD of the stars located within 4 × rh from the galaxy center (panel d). An inset positioned at the top of the panel offers a zoomed-in view of the HB stage, capturing a narrow colour interval and highlighting the presence of four closely-aligned HB stars.
Current usage metrics show cumulative count of Article Views (full-text article views including HTML views, PDF and ePub downloads, according to the available data) and Abstracts Views on Vision4Press platform.
Data correspond to usage on the plateform after 2015. The current usage metrics is available 48-96 hours after online publication and is updated daily on week days.
Initial download of the metrics may take a while.