Fig. 1.
Download original image
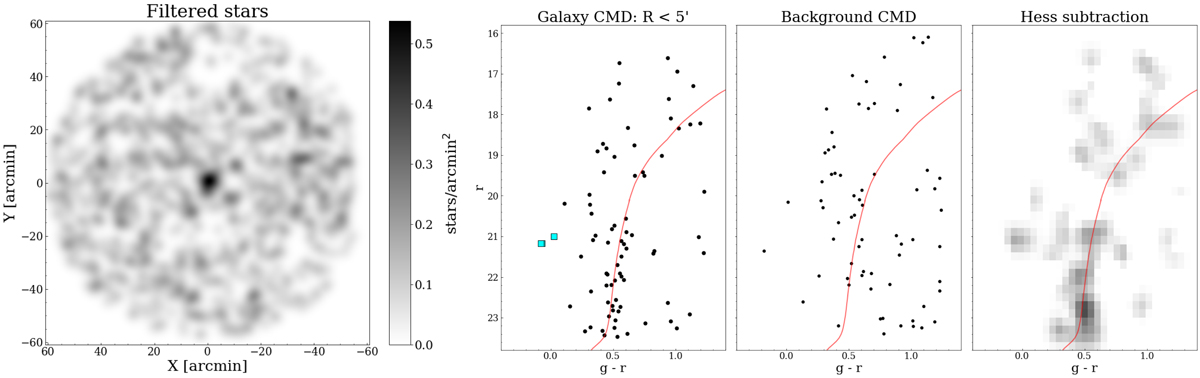
Density map of a region with radius 1° centered on the galaxy candidate. The density map is obtained using stars from the KiDS catalog, and filtered by an isochrone with log(t/yr) = 10.12 dex, [Fe/H] ∼ −1.5 and a distance modulus = 20.4 mag (first panel). We adopted a Gaussian kernel with bandwidth = 2.0′ to smooth the figure. CMD of stars located within 5′ from the over-density center. A red isochrone with log(t/yr) = 10.12 dex; [Fe/H] ∼ −1.5 dex, and m − M = 20.4 mag is superimposed on the figure (second panel). Cyan squares indicate the position of stars compatible with the HB evolutionary stage. CMD of stars within a local field having the same area covered by the CMD built for the dwarf galaxy candidate (third panel). Hess diagram obtained by subtracting the CMDs displayed in the second and third panels (fourth panel).
Current usage metrics show cumulative count of Article Views (full-text article views including HTML views, PDF and ePub downloads, according to the available data) and Abstracts Views on Vision4Press platform.
Data correspond to usage on the plateform after 2015. The current usage metrics is available 48-96 hours after online publication and is updated daily on week days.
Initial download of the metrics may take a while.