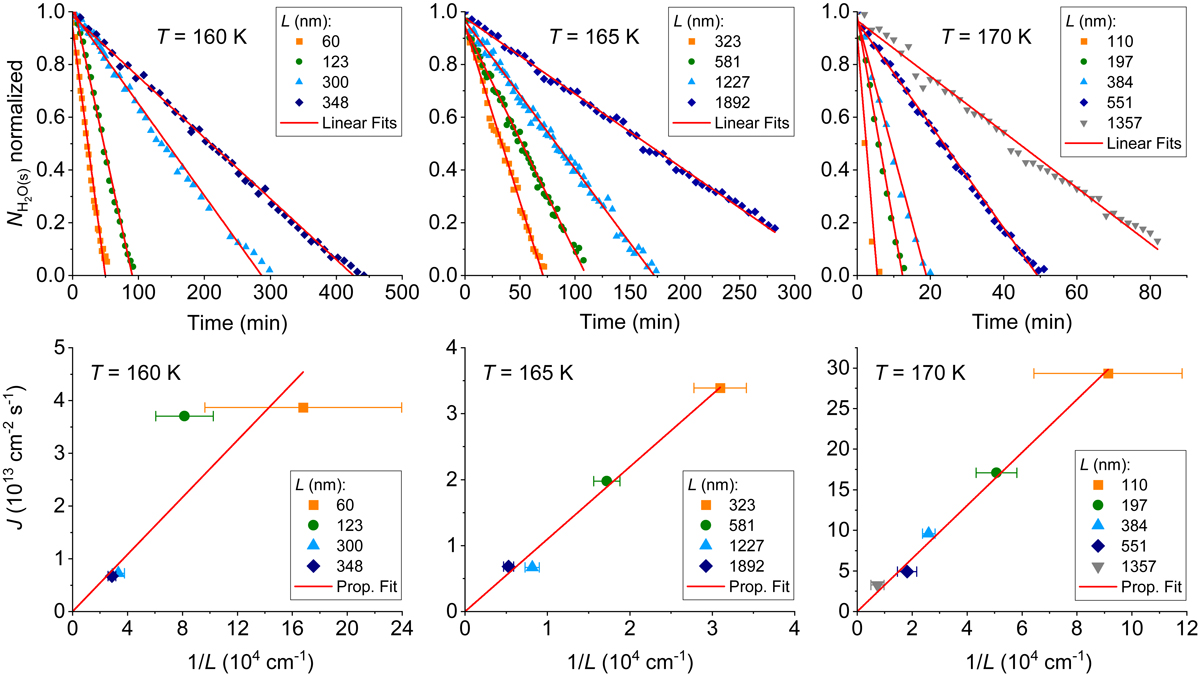
Fig. 3.
Download original image
Experimental results. Time evolution of NH2O(s), normalized to its initial value, during isothermal experiments at 160 K (left), 165 K (middle), and 170 K (right) shown in the top panel, for several values of L, the thickness of the top layer of a-C grains. Bottom panels show the Molecular flux JH2O derived from proportional fits of the linear decays of NH2O(s) reported in the top panels, plotted as a function of 1/L. Error bars reflect the uncertainty introduced by ϵ and LC (see Appendix B).
Current usage metrics show cumulative count of Article Views (full-text article views including HTML views, PDF and ePub downloads, according to the available data) and Abstracts Views on Vision4Press platform.
Data correspond to usage on the plateform after 2015. The current usage metrics is available 48-96 hours after online publication and is updated daily on week days.
Initial download of the metrics may take a while.