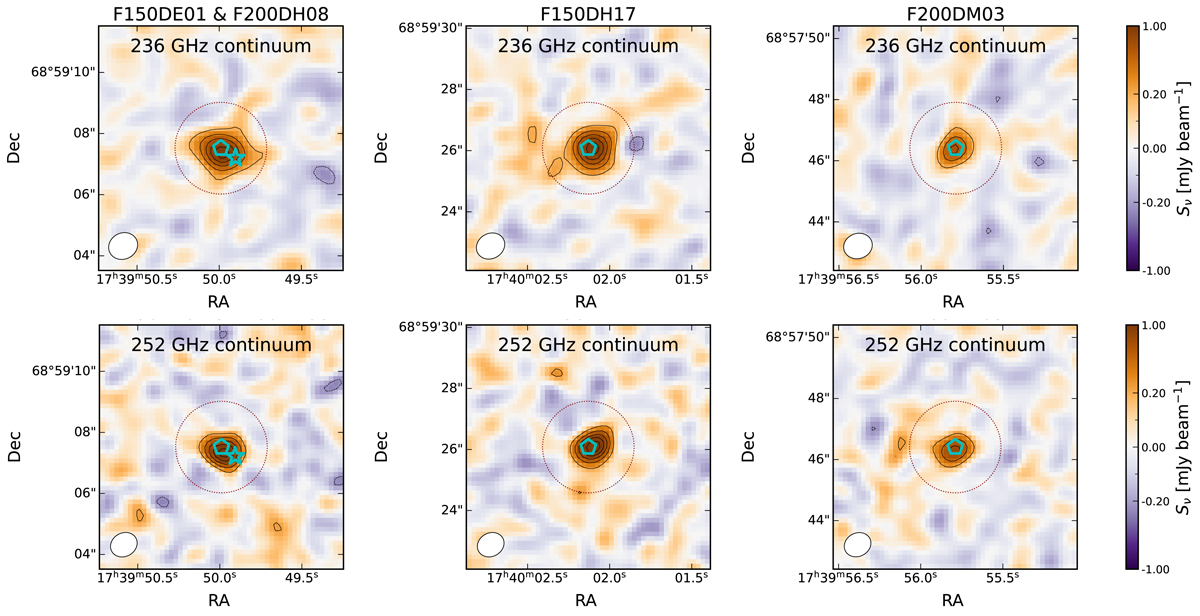
Fig. 1.
Download original image
NOEMA continuum observations of the four red 1.5–2.0 μm dropouts from the PEARLS-IDF data in Yan et al. (2023a, indicated with cyan symbols). We show the 236 GHz (top row) and 252 GHz continuum (bottom row) for each object with the galaxies position from JWST indicated cyan symbols. The full contours indicate the (3, 6, 9, 15)σ level, where σ is the root mean square (rms) noise in the images. The dashed contours show the −3σ level. The red dashed circle shows a r = 2″ aperture.
Current usage metrics show cumulative count of Article Views (full-text article views including HTML views, PDF and ePub downloads, according to the available data) and Abstracts Views on Vision4Press platform.
Data correspond to usage on the plateform after 2015. The current usage metrics is available 48-96 hours after online publication and is updated daily on week days.
Initial download of the metrics may take a while.