Fig. 2.
Download original image
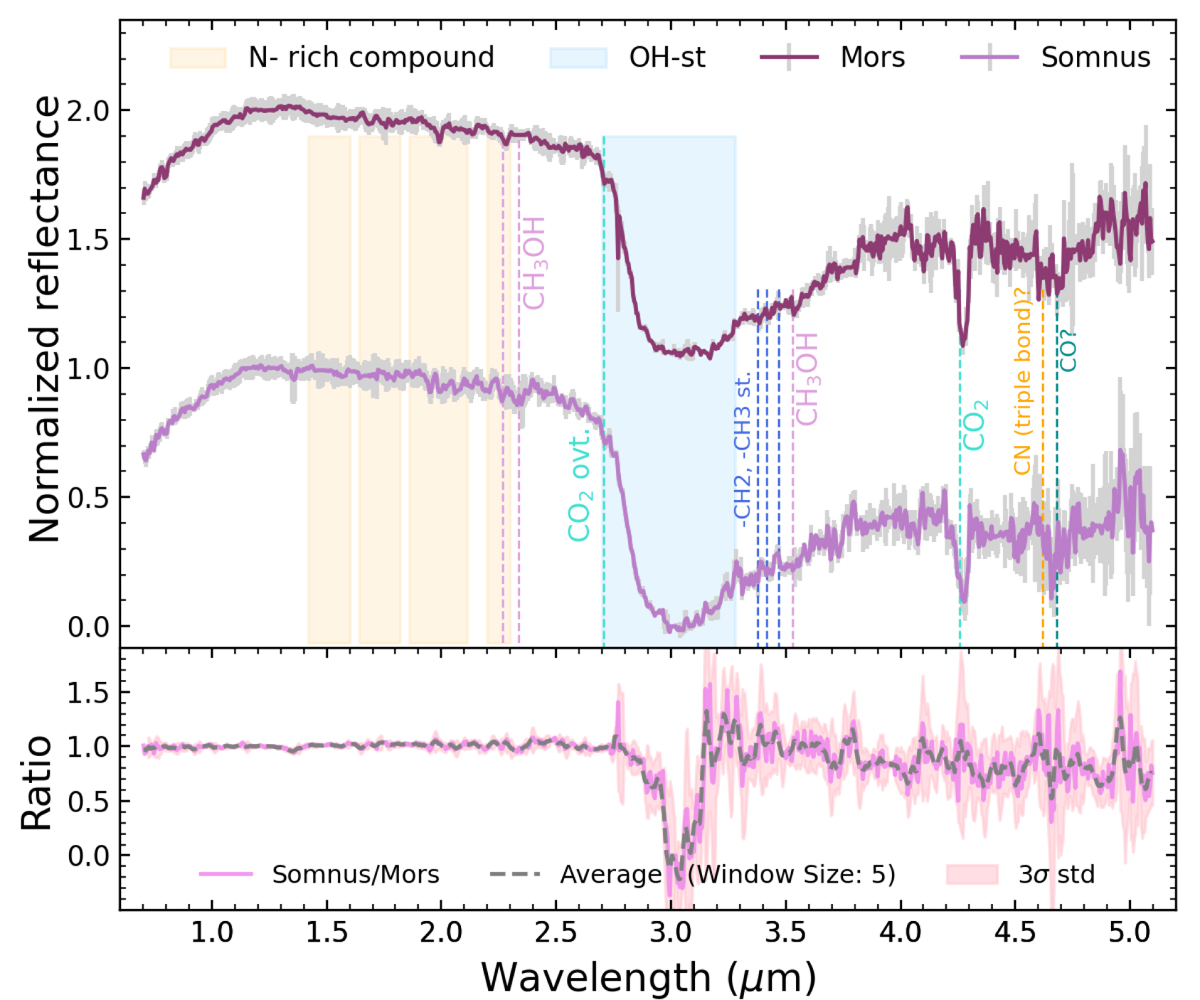
Ice species identification in the spectra of Mors and Somnus. Top: Tentative species identifications in the spectra of Mors (dark purple) and Somnus (light purple). The spectra were both normalized at 1.25 μm and the spectrum of Mors was shifted 1.0 units up for clarity. The dashed vertical lines represent the center positions of the molecular absorption features. The shaded regions represent where the listed materials can absorb. Methanol (CH3OH) is shown in pink, carbon dioxide (CO2) and its overtones in light green, carbon monoxide (CO) in teal, OH-stretch in light blue, carbon-nitrogen-rich compounds in orange, and aliphatic complex organic molecules in dark blue. The gray bars represent the 1σ errors associated with the normalized spectra. Bottom: Ratio between the spectrum of Somnus and Mors (pink line). The average moving ratio is shown as a gray dashed line (window size = 5), and the 3σ standard deviation is shown as a pink shaded region.
Current usage metrics show cumulative count of Article Views (full-text article views including HTML views, PDF and ePub downloads, according to the available data) and Abstracts Views on Vision4Press platform.
Data correspond to usage on the plateform after 2015. The current usage metrics is available 48-96 hours after online publication and is updated daily on week days.
Initial download of the metrics may take a while.