Fig. 9.
Download original image
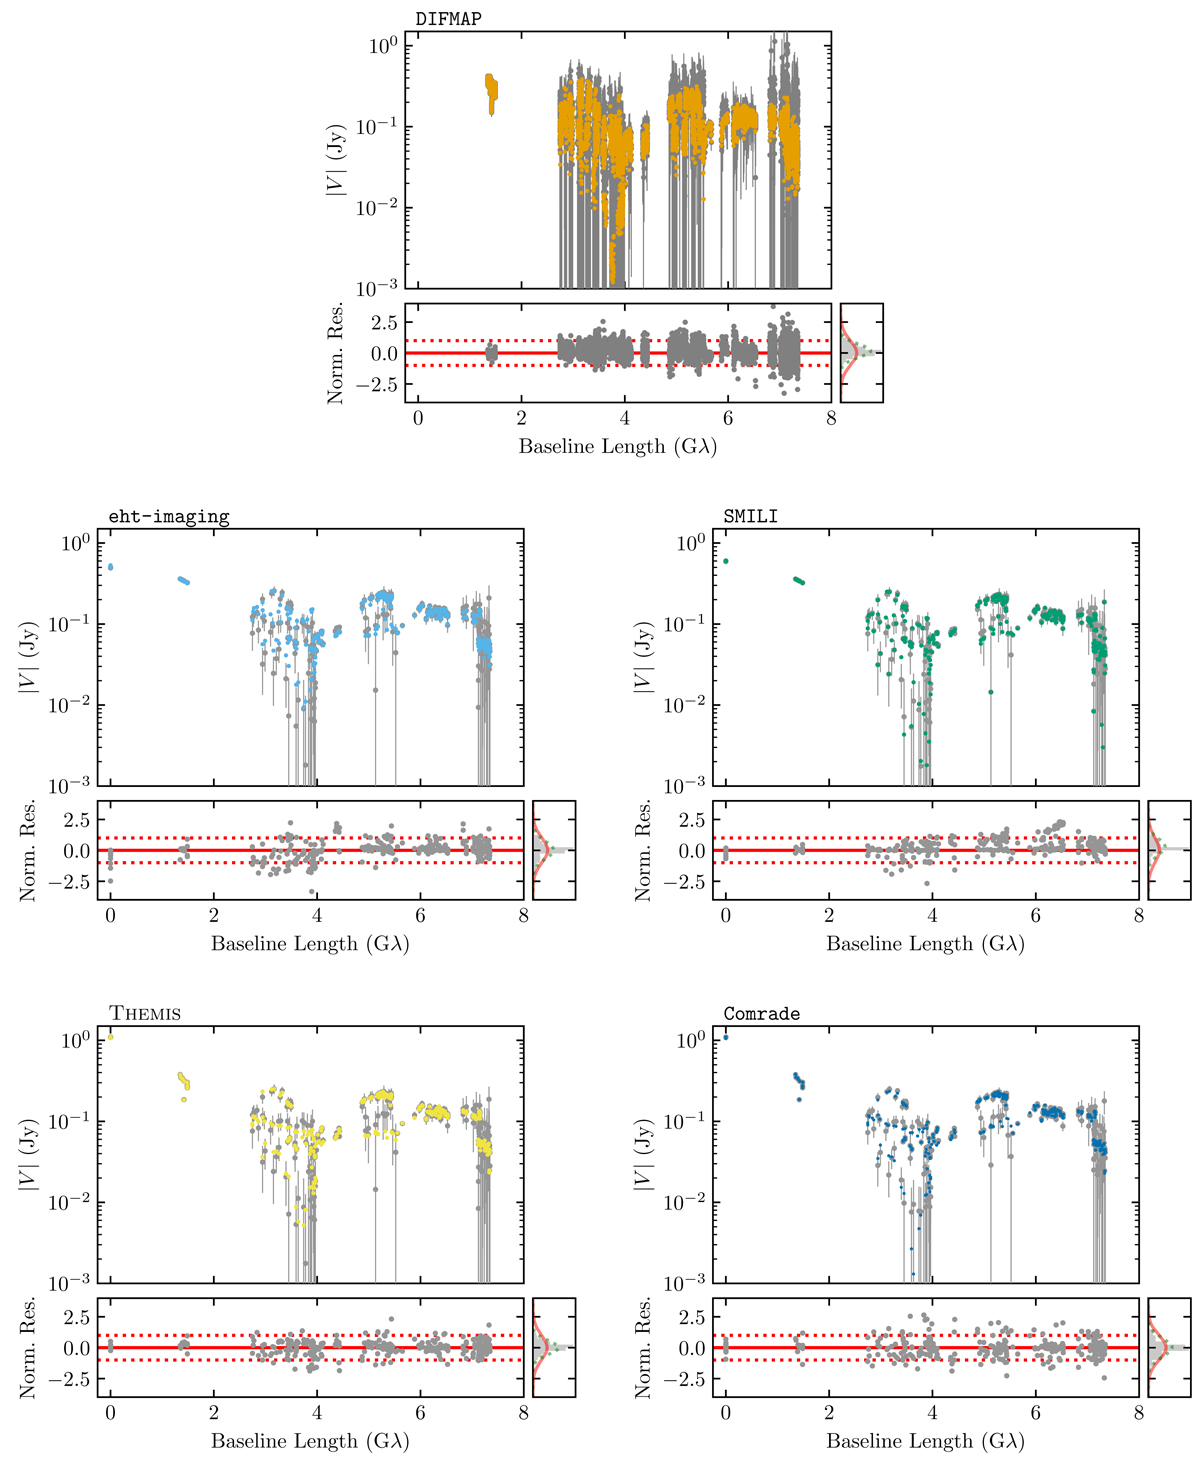
Visibility amplitudes of band 3 data on April 21 as a function of baseline length compared with corresponding gain-calibrated visibility amplitudes from the five representative image models from each pipeline. The fiducial images are used for DIFMAP, eht-imaging, and SMILI, and the maximum likelihood model from the sampling chains are used for THEMIS and maximum a posteriori model for Comrade. The gray points represent the data used by each method after flagging, but before individual self-calibration. eht-imaging scales the intra-site baselines to 0.5 Jy, and SMILI scales the intra-site baselines to 0.6 Jy, and both pre-calibrate the LMT-SMT baselines before fitting. DIFMAP uses 10 s averaged data, and all other methods use scan-averaged data. THEMIS and Comrade apply 1% fractional systematic noise to all baselines, and eht-imaging and SMILI apply 1% and 0% fractional systematic noise respectively to all baselines, seen as minor differences in the gray points. The colored points represent the image model visibilities from each method, with station gains derived from each method’s internal self-calibration procedure applied to the image model visibilities. Below each visibility amplitude figure are the normalized residuals for each image, which is the difference between the gray and the colored points, divided by the uncertainty of the gray data points.
Current usage metrics show cumulative count of Article Views (full-text article views including HTML views, PDF and ePub downloads, according to the available data) and Abstracts Views on Vision4Press platform.
Data correspond to usage on the plateform after 2015. The current usage metrics is available 48-96 hours after online publication and is updated daily on week days.
Initial download of the metrics may take a while.