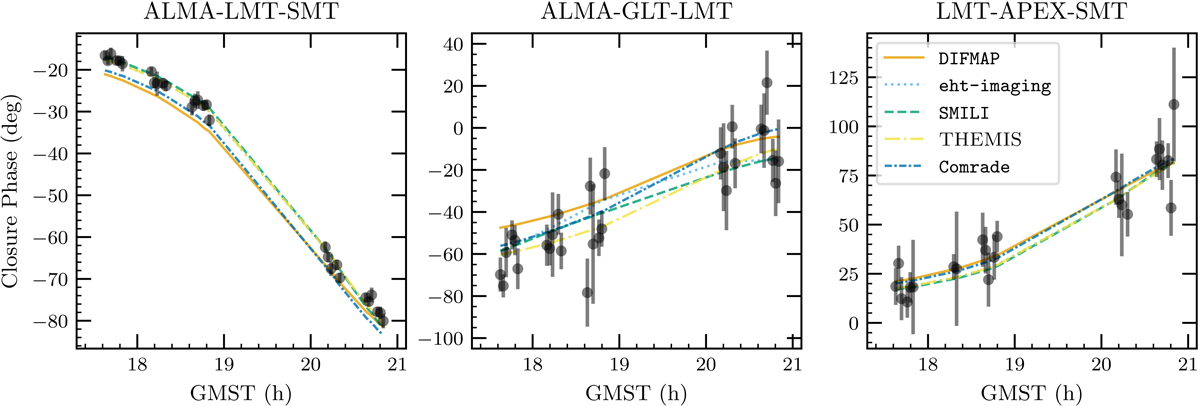
Fig. 8.
Download original image
Closure phases plotted as a function of GMST on three selected triangles from the April 21 band 3 observations (black points). The error bars on the data points denote the ±1σ uncertainties. The colored and dashed lines indicate the model closure phase curves from the fiducial images or posterior samples produced by the five imaging pipelines.
Current usage metrics show cumulative count of Article Views (full-text article views including HTML views, PDF and ePub downloads, according to the available data) and Abstracts Views on Vision4Press platform.
Data correspond to usage on the plateform after 2015. The current usage metrics is available 48-96 hours after online publication and is updated daily on week days.
Initial download of the metrics may take a while.