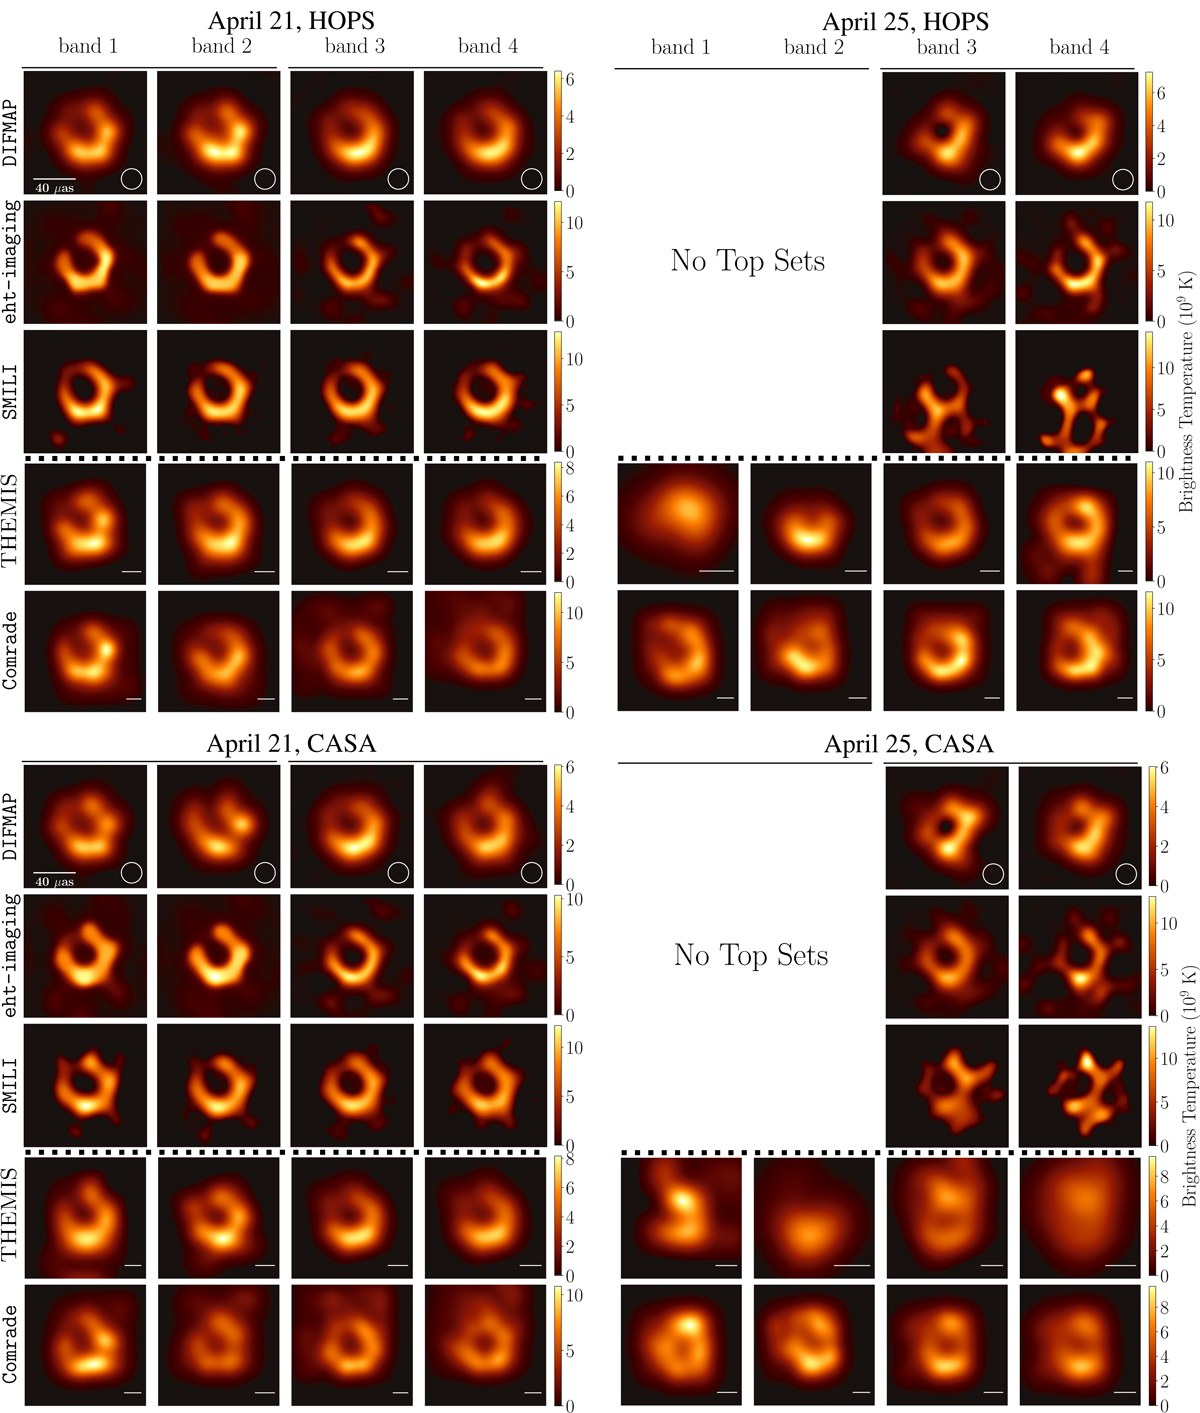
Fig. 7.
Download original image
Representative images recovered from the HOPS and CASA data with all five imaging pipelines for two observing days (April 21 and 25). Each panel shows the fiducial image of the corresponding top set images for the DIFMAP, eht-imaging, and SMILI pipelines, and a random sample from the respective posterior for the THEMIS and Comrade pipelines. We do not have Top Sets for band 1 and band 2 from DIFMAP, eht-imaging, and SMILI pipelines on April 25. The dashed horizontal line in each block separates the DIFMAP and RML methods above from the Bayesian methods below. The circles in the DIFMAP panels represent an effective Gaussian blurring kernel of 20 μas. The solid lines in the THEMIS and Comrade panels represent the size of the blurring kernel used to achieve the same effective resolution as the DIFMAP method.
Current usage metrics show cumulative count of Article Views (full-text article views including HTML views, PDF and ePub downloads, according to the available data) and Abstracts Views on Vision4Press platform.
Data correspond to usage on the plateform after 2015. The current usage metrics is available 48-96 hours after online publication and is updated daily on week days.
Initial download of the metrics may take a while.