Fig. 6.
Download original image
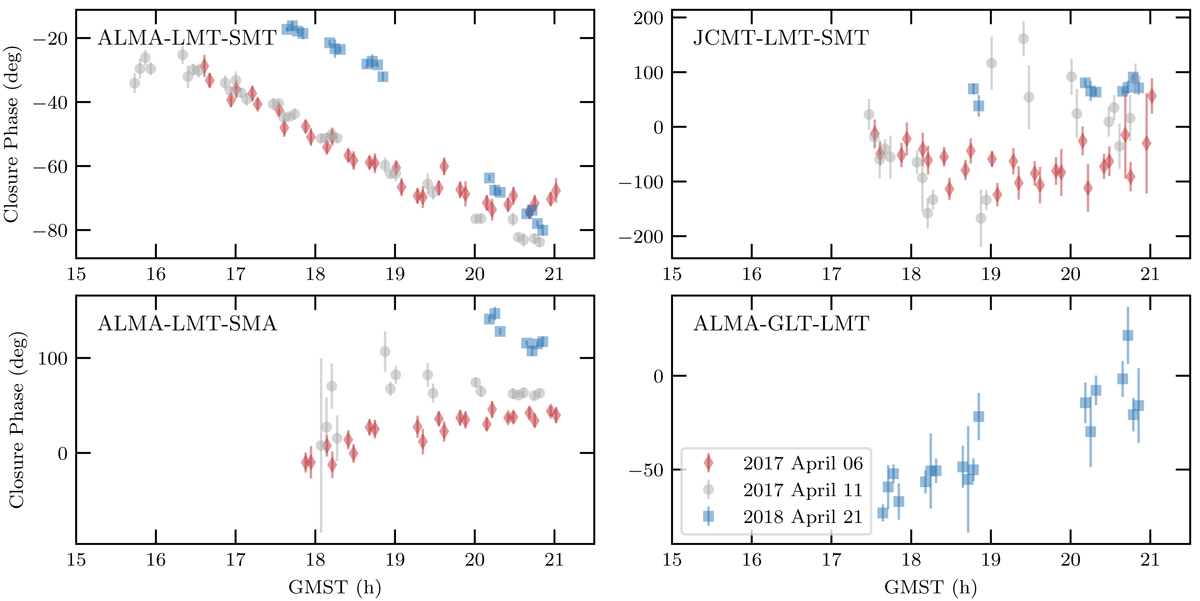
Variation of closure phases as a function of Greenwich mean sidereal time (GMST) for selected triangles using HOPS calibrated data. Red diamonds denote data from 2017 April 6 (low-band), gray circles denote data from 2017 April 11 (low-band), and blue squares denote data from 2018 April 21 (band 3). Error bars are the ±1σ uncertainties.
Current usage metrics show cumulative count of Article Views (full-text article views including HTML views, PDF and ePub downloads, according to the available data) and Abstracts Views on Vision4Press platform.
Data correspond to usage on the plateform after 2015. The current usage metrics is available 48-96 hours after online publication and is updated daily on week days.
Initial download of the metrics may take a while.