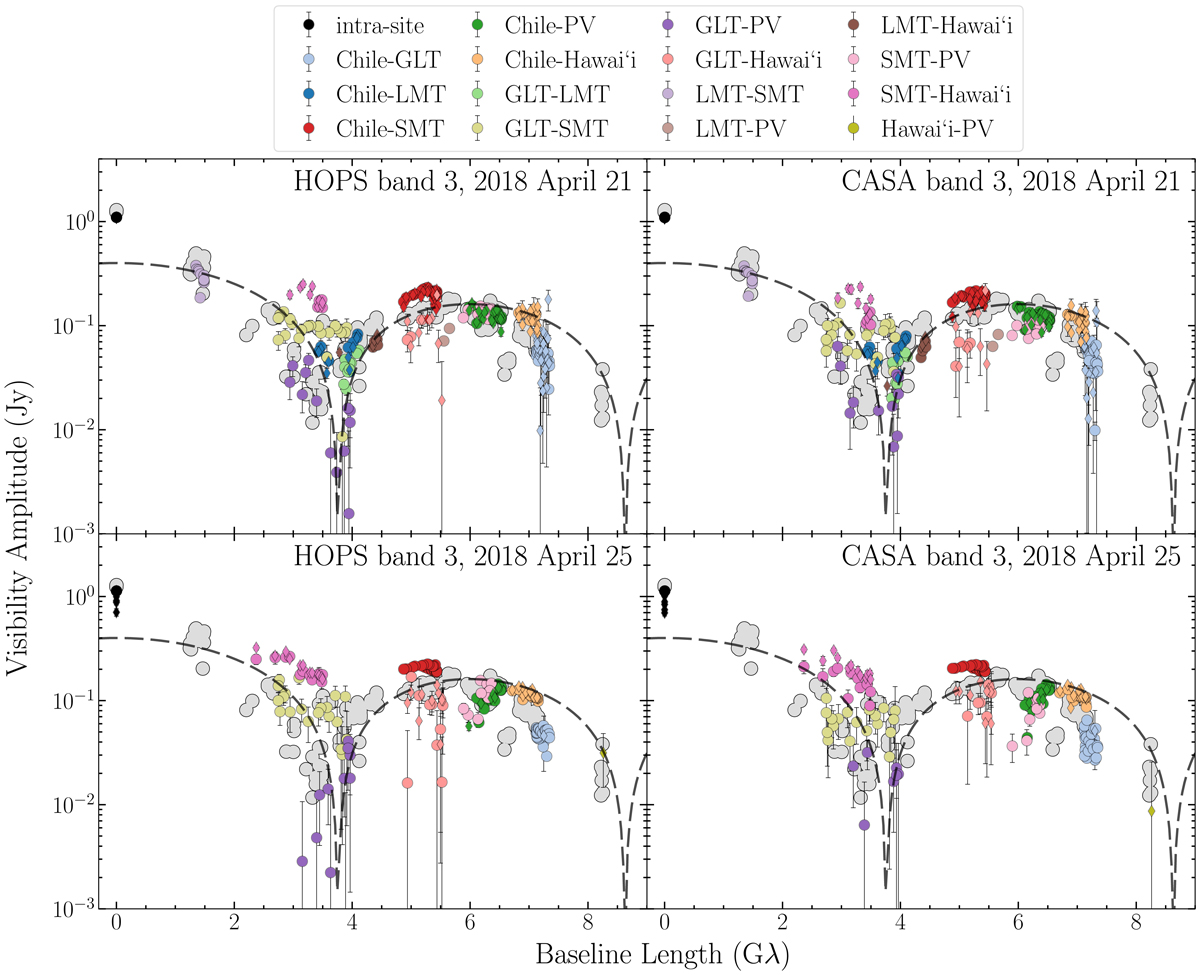
Fig. 5.
Download original image
Measured correlated flux densities of M 87* as a function of baseline lengths in units of wavelength, for 2018 April 21 (top panels) and April 25 (bottom panels) in band 3, for both HOPS (left panels) and CASA (right panels) outputs. The 2018 data (colored points) are overlaid on the corresponding flux densities of the 2017 April 11 observations in low-band (gray points). All data shown include a priori station-based amplitude calibration and network calibration but are prior to any model-dependent self-calibration. Error bars denote ±1σ from thermal noise. Redundant baselines are shown with different symbols: circles for baselines to ALMA and SMA; diamonds for baselines to APEX and JCMT. The dashed line corresponds to an azimuthally symmetric thin ring model with a 42 μas diameter.
Current usage metrics show cumulative count of Article Views (full-text article views including HTML views, PDF and ePub downloads, according to the available data) and Abstracts Views on Vision4Press platform.
Data correspond to usage on the plateform after 2015. The current usage metrics is available 48-96 hours after online publication and is updated daily on week days.
Initial download of the metrics may take a while.