Fig. E.1.
Download original image
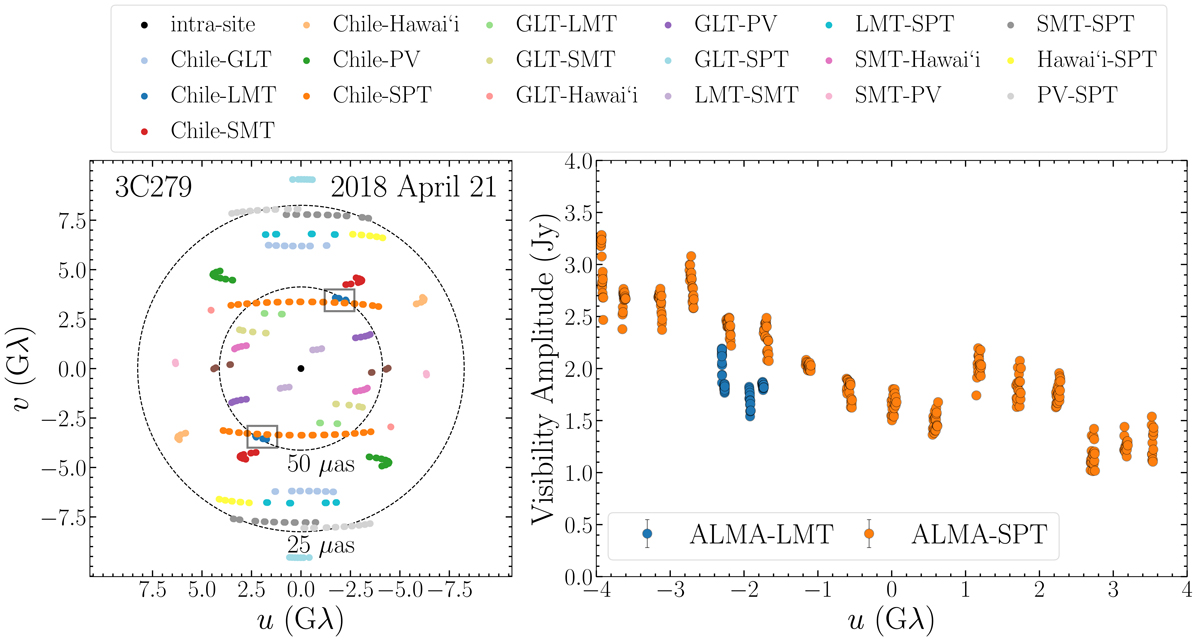
Left: (u, v) coverage for 3C 279 observations in band 3 on 2018 April 21 (colored points), showing the overlap between ALMA–LMT and ALMA–SPT baselines (highlighted with a box). Right: band 3 flux densities on ALMA–LMT (blue) and ALMA–SPT (orange) as a function of the projected baseline length in the east-west direction, in units of wavelength, demonstrating the under-calibration of amplitudes on LMT baselines. HOPS data are shown in this figure, but are consistent with that from CASA.
Current usage metrics show cumulative count of Article Views (full-text article views including HTML views, PDF and ePub downloads, according to the available data) and Abstracts Views on Vision4Press platform.
Data correspond to usage on the plateform after 2015. The current usage metrics is available 48-96 hours after online publication and is updated daily on week days.
Initial download of the metrics may take a while.