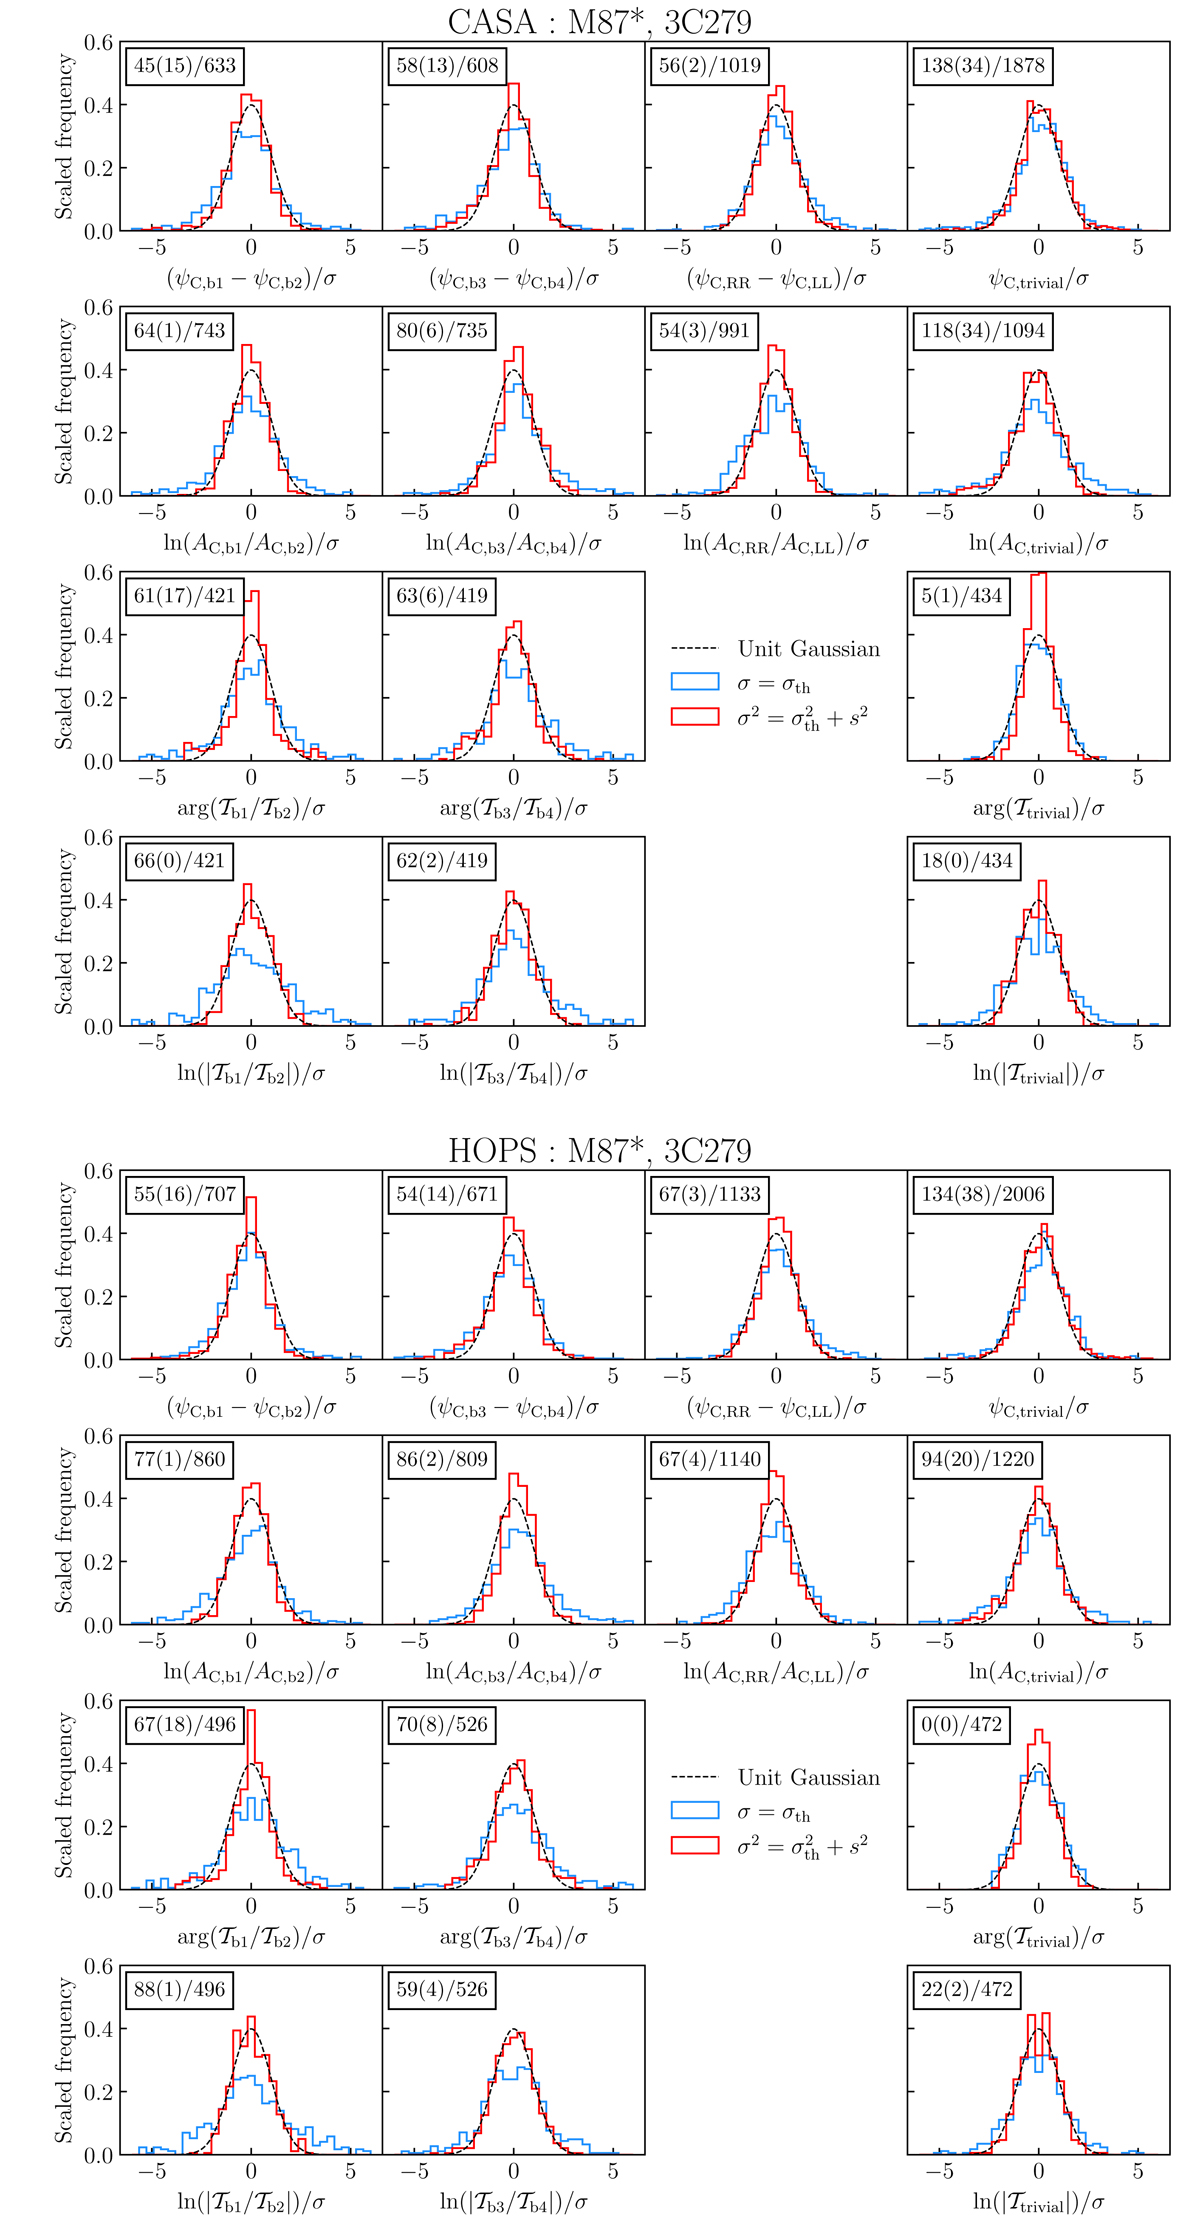
Fig. B.1.
Download original image
Diagnostic plots showing the normalized distributions of various closure quantities of M87* and 3C 279 data from both the CASA (top four rows) and HOPS (bottom four rows) reduction pipelines. For each block corresponding to each pipeline, the first two rows show band 1 − band 2 (first column), band 3 − band 4 (second column), RR−LL (third column), and trivial (fourth column) closure quantities. The bottom two rows show band 1 − band 2 (first column), band 3 − band 4 (second column), and trivial (third column) closure trace quantities. Only data from April 21 and 25 have been used. The distributions prior to (blue) and after (red) accounting for the estimated systematic uncertainties, s, are shown. The values of s for each source and reduction pipeline are given in Table B.1. In the top left corner of each distribution, the number of > 3σ outliers are given considering thermal noise only, followed by the number of outliers considering thermal plus systematic noise for σ in parenthesis. These numbers are followed by the total number of data points after a slash.
Current usage metrics show cumulative count of Article Views (full-text article views including HTML views, PDF and ePub downloads, according to the available data) and Abstracts Views on Vision4Press platform.
Data correspond to usage on the plateform after 2015. The current usage metrics is available 48-96 hours after online publication and is updated daily on week days.
Initial download of the metrics may take a while.