Fig. 2.
Download original image
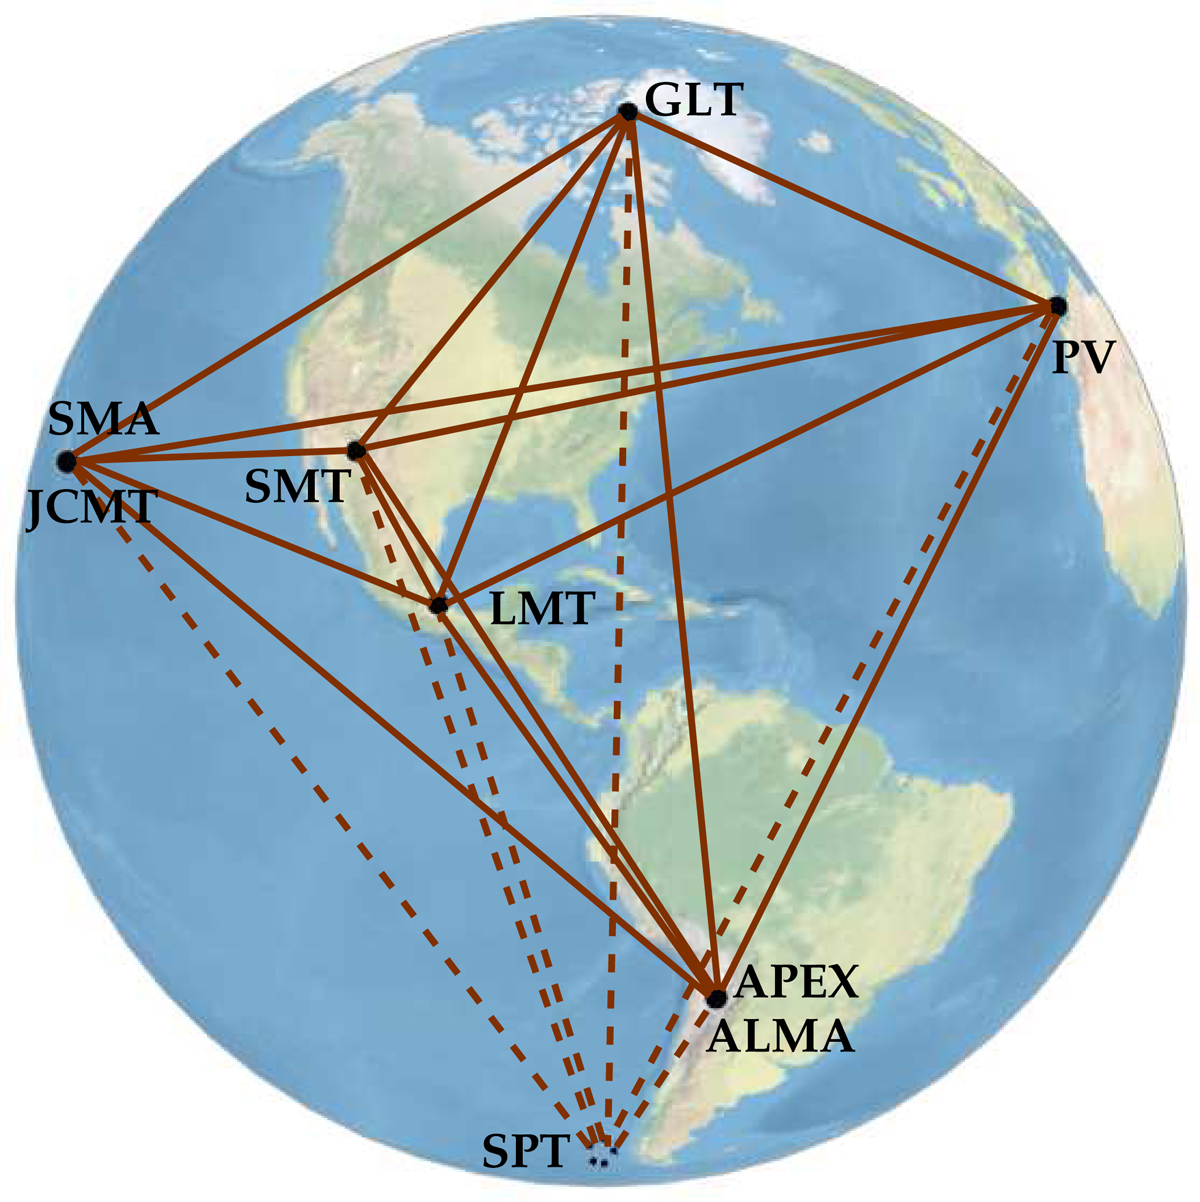
Map showing the stations that participated in the EHT 2018 campaign (black circles), which differs from the EHT array in 2017 by the addition of the GLT. Co-located sites in Chile and Hawai‘i appear superimposed. The SPT projected location from the back of the map is indicated with a dashed circle, and baselines to this station are represented with dashed-lines. While the SPT cannot observe M 87*, it observed 3C 279 and was used to calibrate the data.
Current usage metrics show cumulative count of Article Views (full-text article views including HTML views, PDF and ePub downloads, according to the available data) and Abstracts Views on Vision4Press platform.
Data correspond to usage on the plateform after 2015. The current usage metrics is available 48-96 hours after online publication and is updated daily on week days.
Initial download of the metrics may take a while.