Fig. 19.
Download original image
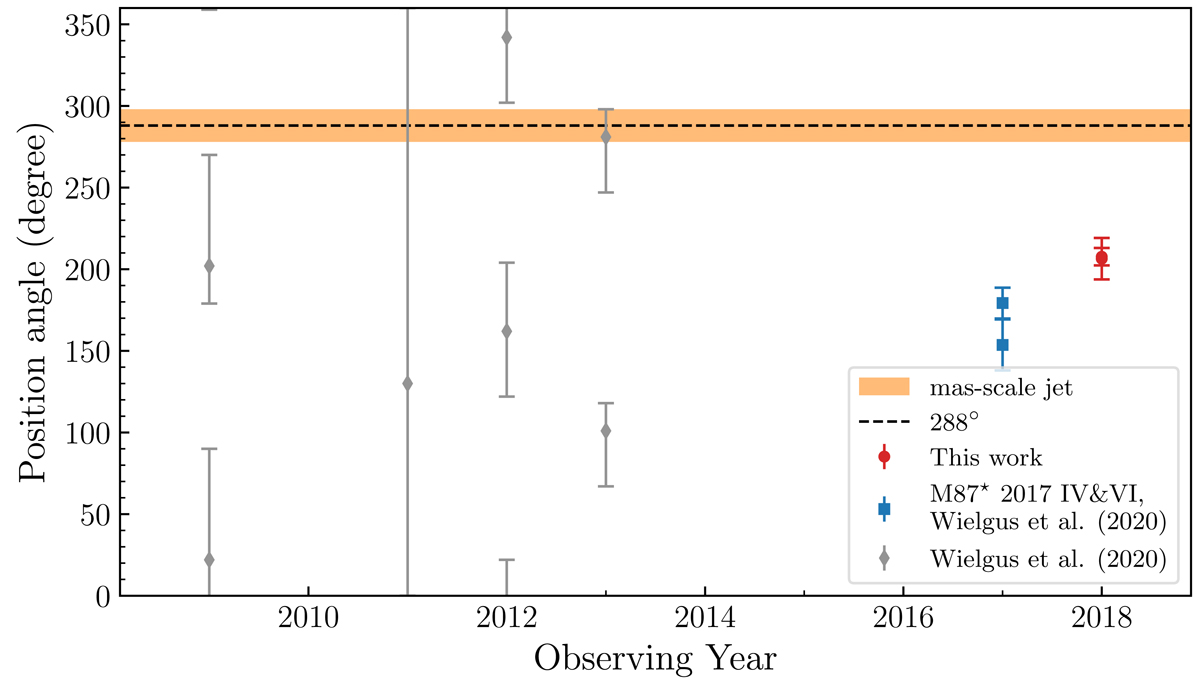
Comparison of the brightness position angle measured in the EHT observations during 2009−2018. The orange shadow covering (288 ± 10)° indicates the observational position angle range of the milliarcsecond-scale jet (Walker et al. 2018; Cui et al. 2023). The red points for 2018 are the median values after combining the posteriors of all bands on April 21 and April 25 (see Table 11). The blue points for April 6 and April 11 in 2017 are adopted from M 87∗ 2017 IV, M 87∗ 2017 VI and Wielgus et al. (2020, see the Table 4). The gray points for 2009−2013 are adopted from Table 3 in Wielgus et al. (2020), and represent the 68% confidence intervals. The posterior shapes for the 2009−2013 are non-Gaussian, and exhibit large tails.
Current usage metrics show cumulative count of Article Views (full-text article views including HTML views, PDF and ePub downloads, according to the available data) and Abstracts Views on Vision4Press platform.
Data correspond to usage on the plateform after 2015. The current usage metrics is available 48-96 hours after online publication and is updated daily on week days.
Initial download of the metrics may take a while.