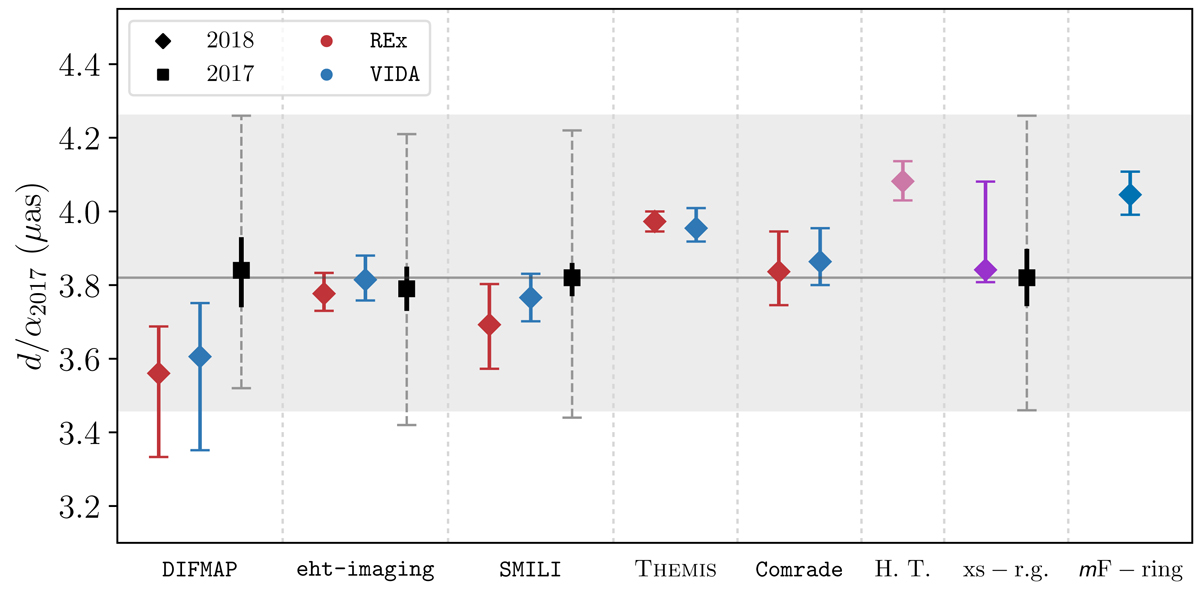
Fig. 18.
Download original image
Comparisons of d/α2017, which serves as a proxy for θg, using multiple methods for 2017 (squares) and 2018 April 21 band 3 (diamonds). For the 2018 methods which have a corresponding θg calibration from the 2017 analysis (DIFMAP, eht-imaging, SMILI, xs-ringauss), we use the method-specific 2017 scaling factor to determine the 2018 d/α2017 values. For DIFMAP, eht-imaging, and SMILI we use the scaling factors from Table 6 of M 87∗ 2017 VI, and for the xs-ringauss we use the scaling factors from Table 4 of M 87∗ 2017 VI. For the 2018 methods which do not have a 2017 θg calibration (THEMIS, Comrade, mF-ring), we use α = 11.0, coming from the median α across all 2017 methods (M 87∗ 2017 I). The error bars for the 2018 points are representative of the 68% confidence intervals of the model-specific diameter estimates. The two image domain feature extraction methods are shown with red points for REx and blue points for VIDA. For the 2017 points, we show the measured θg (black squares), the uncertainty due to differences in the 2017 observational details (σobs, solid black error bars), and the uncertainty due to the diversity of the 2017 GRMHD library (σthy, gray dashed error bars). The gray horizontal line and shaded region represent the 2017 θg value and σthy uncertainty for the xs-ringauss model. While the uncertainty in diameter for some of the 2018 methods is larger than that for the same methods in 2017, the uncertainty related to the different GRMHD models used as the calibration set dominates and spans all methods.
Current usage metrics show cumulative count of Article Views (full-text article views including HTML views, PDF and ePub downloads, according to the available data) and Abstracts Views on Vision4Press platform.
Data correspond to usage on the plateform after 2015. The current usage metrics is available 48-96 hours after online publication and is updated daily on week days.
Initial download of the metrics may take a while.