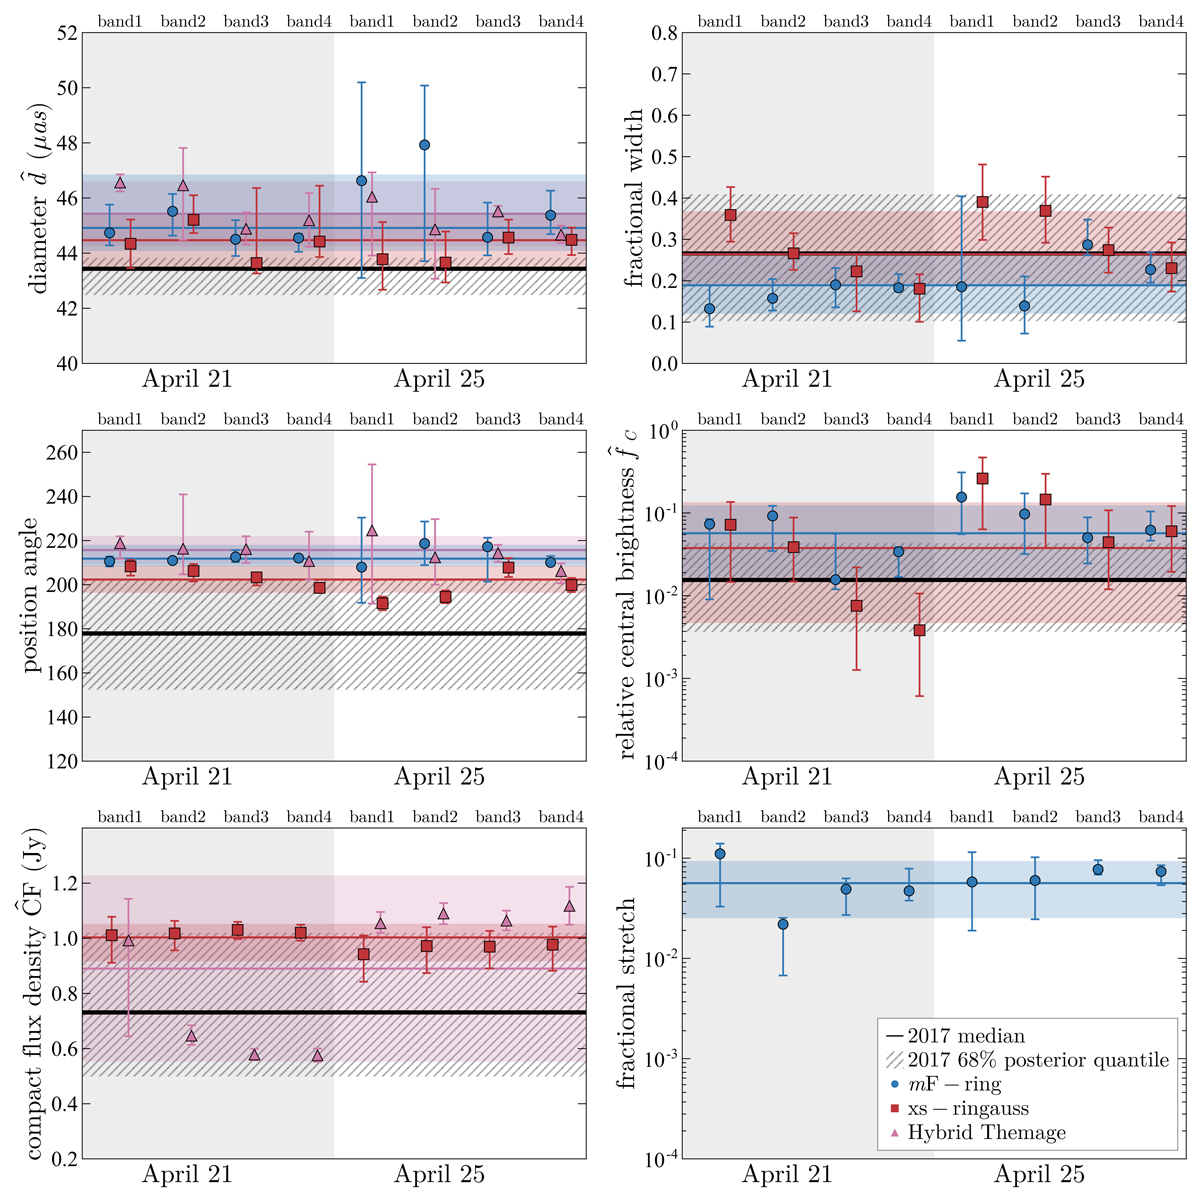
Fig. 16.
Download original image
Fitted features of the xs-ringauss, mF-ring, and Hybrid Themage fiducial models to the 2018 M 87* HOPS data. We include fits from bands 1 through 4 on April 21 and April 25. Each point shows the median value of the posterior distribution and the error bars indicate the 68% posterior probability range centered around the median. The blue line and band represent the median and 68% confidence interval for the posterior generated by combining all bands and all days for the mF-ring model, while the red band is the equivalent for the xs-ringauss. The pink lines and bars represent the statistical mean and standard deviations of the Hybrid Themage method. The black line indicates the median over all days and bands of the 2017 M 87* analysis from xs-ringauss fits. The hashed region is the 68% posterior probability interval taken from the 2017 M 87* xs-ringauss fits.
Current usage metrics show cumulative count of Article Views (full-text article views including HTML views, PDF and ePub downloads, according to the available data) and Abstracts Views on Vision4Press platform.
Data correspond to usage on the plateform after 2015. The current usage metrics is available 48-96 hours after online publication and is updated daily on week days.
Initial download of the metrics may take a while.