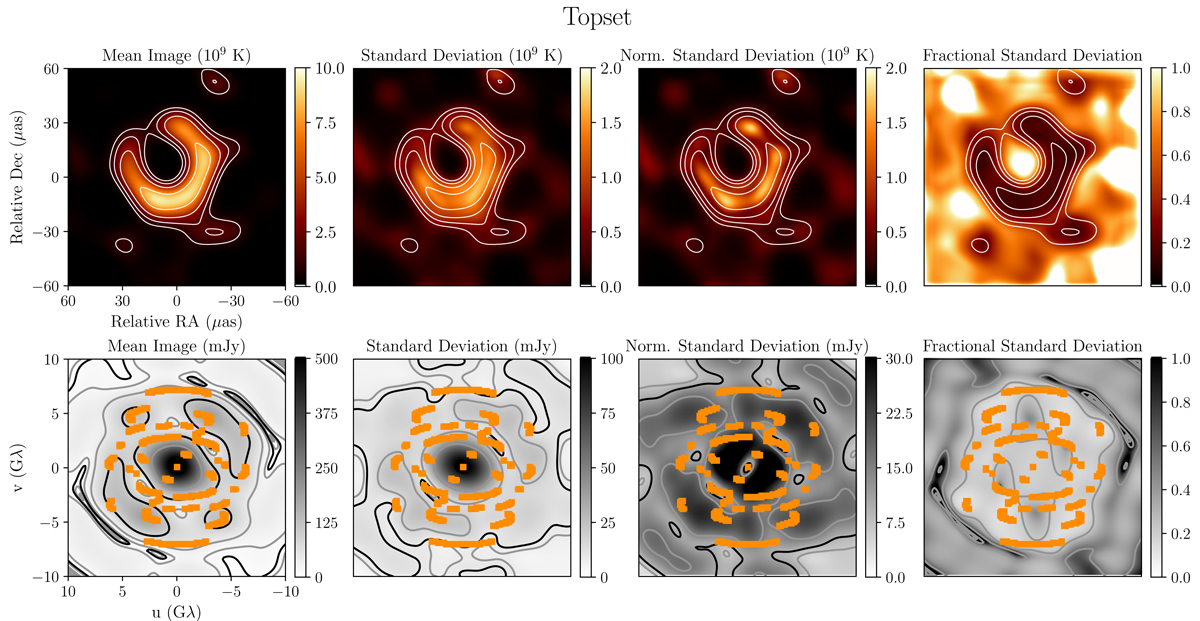
Fig. 10.
Download original image
Visualization of image statistics calculated using the Top Set images from the eht-imaging pipeline for observations taken on April 21 band 3. We emphasize that these images do not represent the posterior probability space for the reconstructions. Each image reconstructed using eht-imaging is the maximum a posteriori (MAP) image for a given parameter set. Thus, the statistics shown represent uncertainties that arise from different choices of regularizer weights, not from an exploration of posterior space. The top row shows top statistics in the image domain while the bottom row shows the visibility domain. Overlaid on the visibility domain panels is the (u, v) coverage for the April 21 observation. From left to right, we present the mean image; the standard deviation; the normalized standard deviation, calculated by rescaling each image to the flux of the mean image; and the fractional standard deviation, calculated by dividing the standard deviation by the mean. The fractional standard deviation panel has been clipped to a maximum value of 1. Portions of the image exhibit large fractional standard deviations due to pixel values very close to zero in the mean image. In the top row, image contours are drawn at 10%, 20%, 40%, and 80% of the peak values from the mean image. In the bottom row, the gray contours represent 0.1%, 1%, and 10% of the peak while the black contours represent 10 and 100 mJy (left three panels) and 0.1 (right most panel). The complex visibilities are calculated by taking a Fourier transform of the images and then calculating the mean and standard deviation. The absolute value of the mean and standard deviation of the complex visibilities are used to calculate visibility amplitudes.
Current usage metrics show cumulative count of Article Views (full-text article views including HTML views, PDF and ePub downloads, according to the available data) and Abstracts Views on Vision4Press platform.
Data correspond to usage on the plateform after 2015. The current usage metrics is available 48-96 hours after online publication and is updated daily on week days.
Initial download of the metrics may take a while.