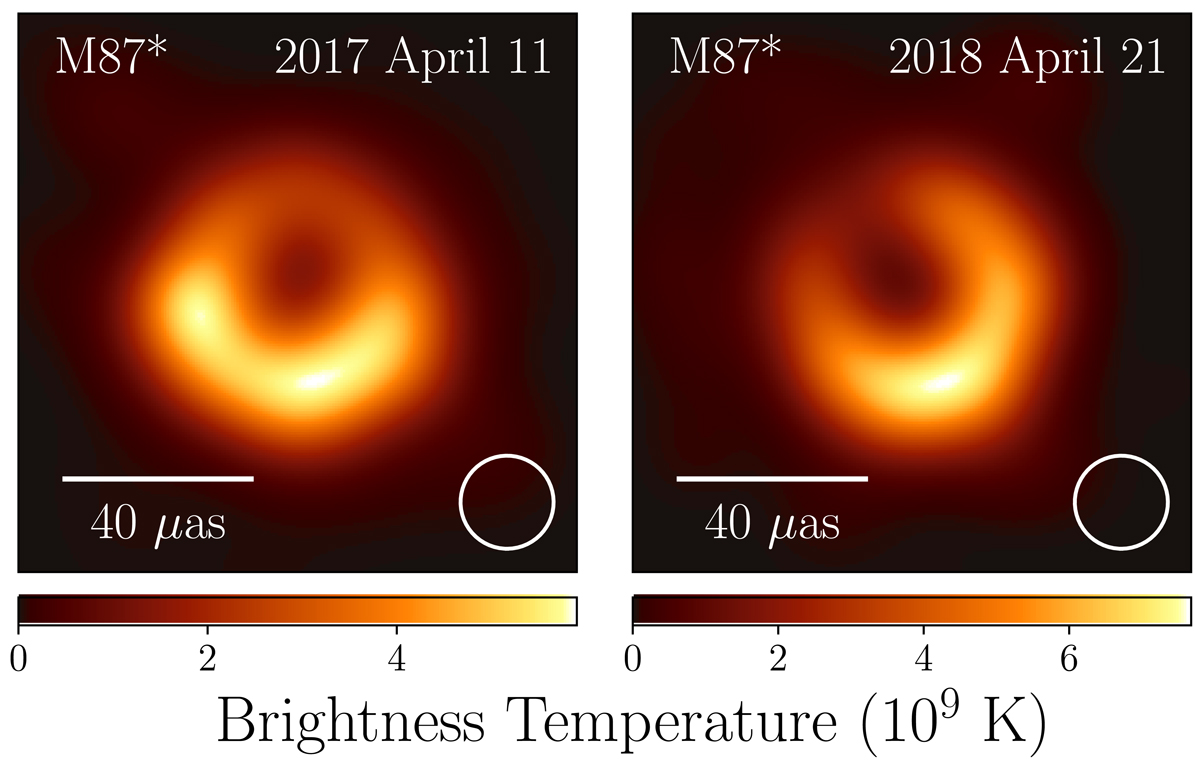
Fig. 1.
Download original image
Representative example images of M 87* from the EHT observations taken on 2017 April 11 and 2018 April 21 (north is up and east is to the left). The 2017 image is generated with the average of fiducial parameter sets from the imaging techniques used in M 87∗ 2017 IV. The 2018 image is created by taking the average of the blurred images generated by the imaging techniques found in Sect. 5. Comparison of the images shows consistency in the diameter across observation epochs, but a shift in position angle of brightness asymmetry. The circle represents a Gaussian blurring kernel with a full width half maximum of 20 μas.
Current usage metrics show cumulative count of Article Views (full-text article views including HTML views, PDF and ePub downloads, according to the available data) and Abstracts Views on Vision4Press platform.
Data correspond to usage on the plateform after 2015. The current usage metrics is available 48-96 hours after online publication and is updated daily on week days.
Initial download of the metrics may take a while.