Open Access
Fig. 5.
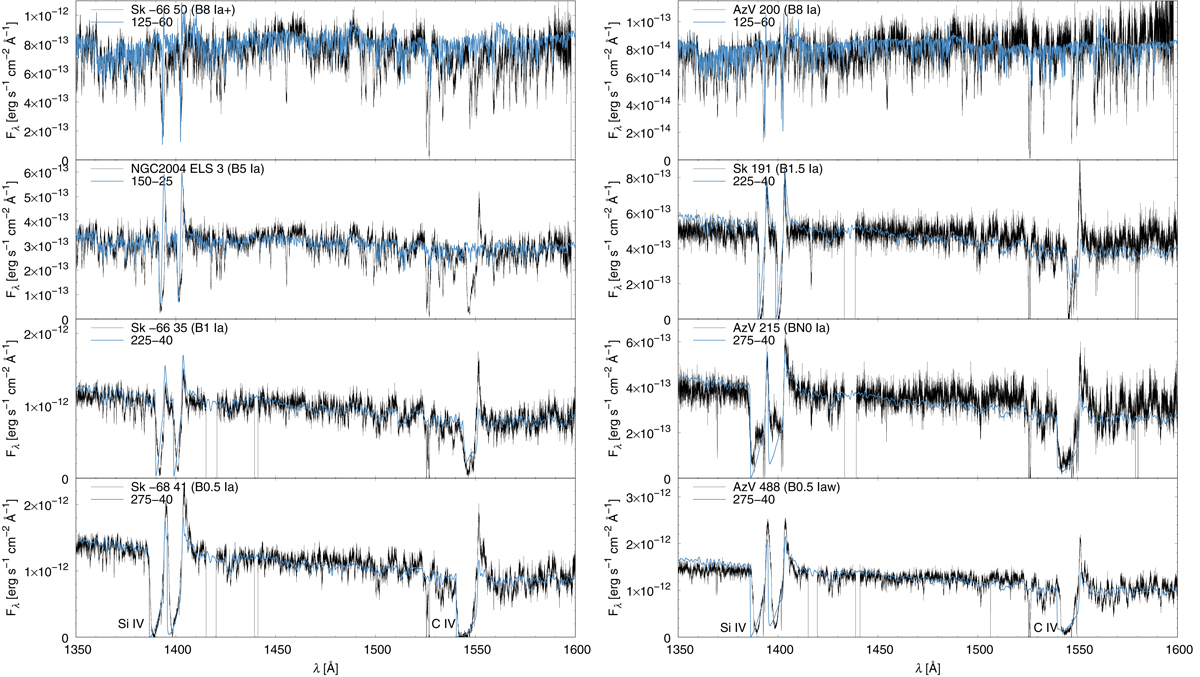
Download original image
Comparison of the spectra of selected B supergiants (black lines) with the emergent spectra of model stars (blue lines) from the grid for the LMC (left panel) and SMC (right panel).
Current usage metrics show cumulative count of Article Views (full-text article views including HTML views, PDF and ePub downloads, according to the available data) and Abstracts Views on Vision4Press platform.
Data correspond to usage on the plateform after 2015. The current usage metrics is available 48-96 hours after online publication and is updated daily on week days.
Initial download of the metrics may take a while.