Fig. 3.
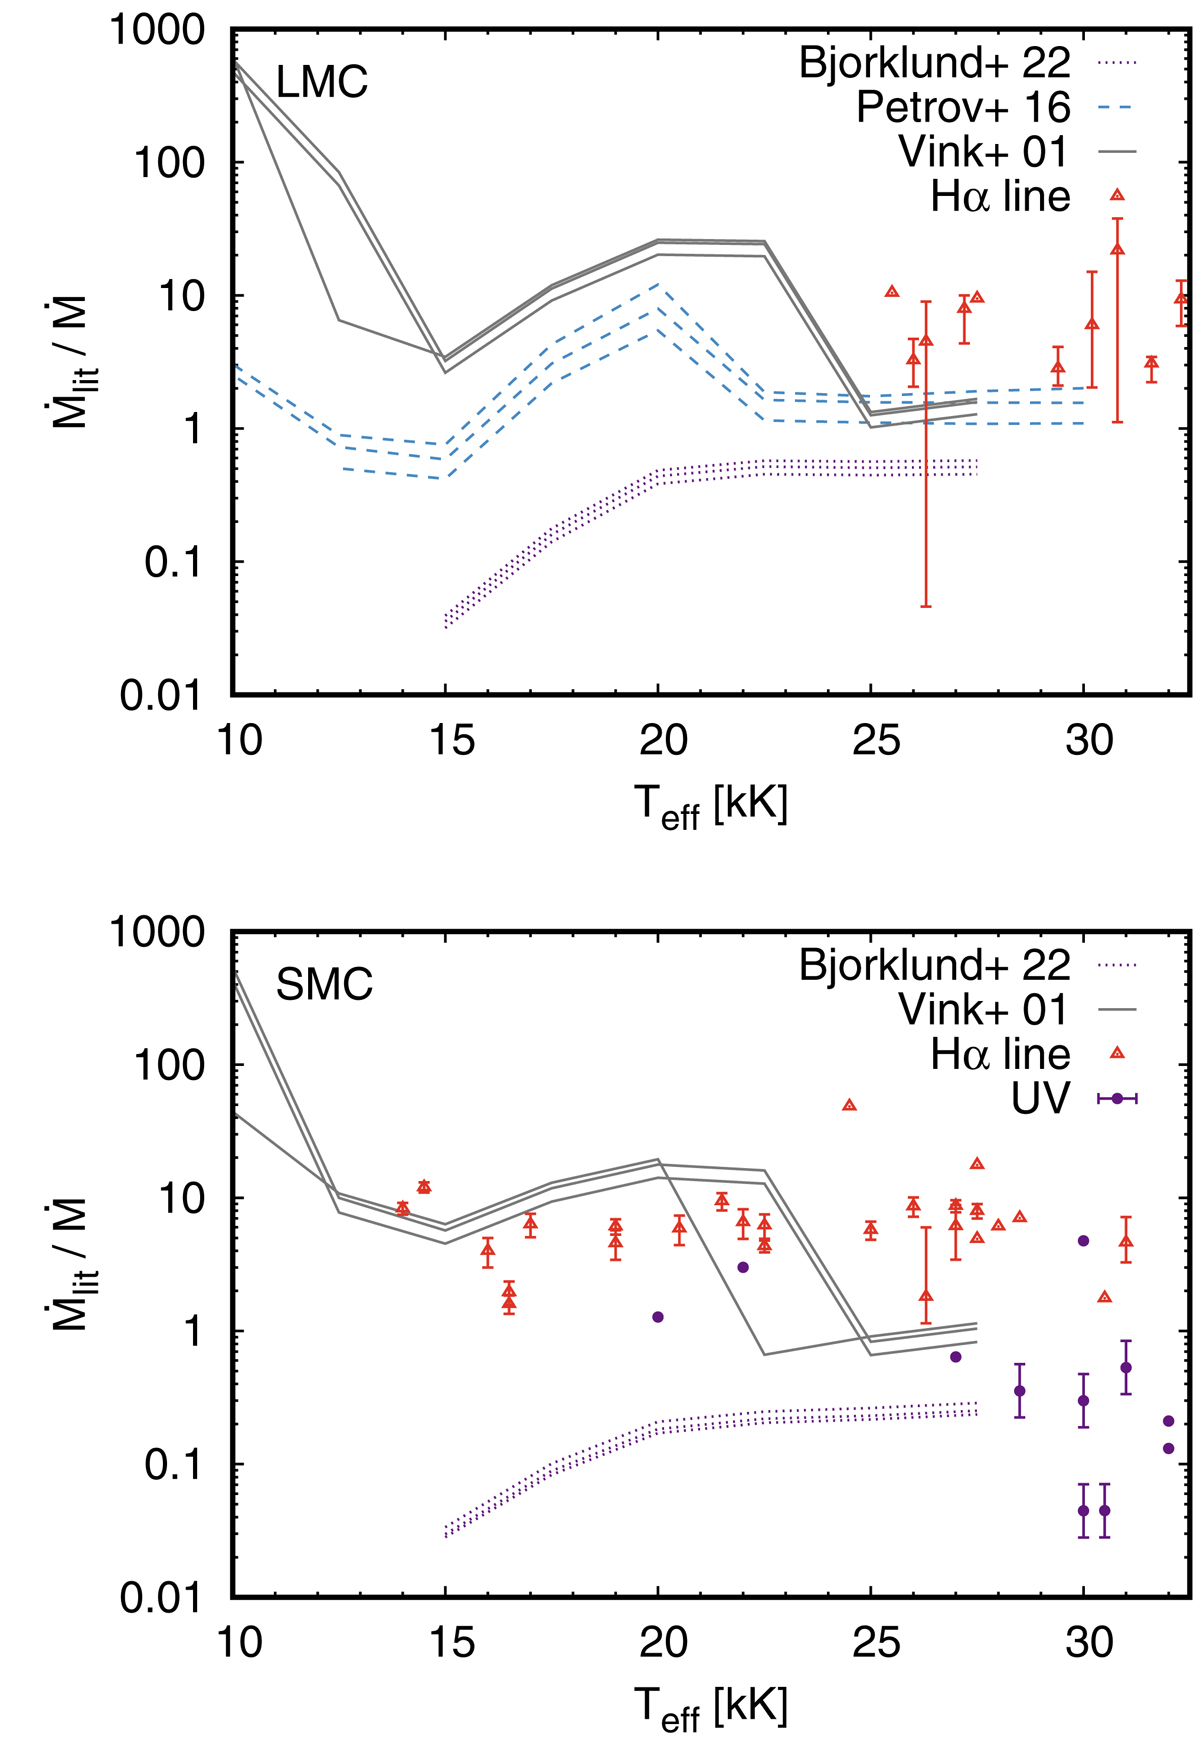
Download original image
Ratio of mass-loss rates derived from the literature and mass-loss rates predicted using Eq. (3) plotted as a function of effective temperature for stars from the LMC (upper panel) and SMC (lower panel). The observational values include mass-loss rates determined from the Balmer lines (mostly Hα line, red triangles; Evans et al. 2004; Trundle et al. 2004; Trundle & Lennon 2005; Mokiem et al. 2006, 2007), and from UV wind lines corrected for clumping (violet dots; Ramachandran et al. 2019; Bouret et al. 2021). Overplotted are theoretical predictions evaluated for stellar parameters from our sample (Vink et al. 2001; Björklund et al. 2023; solid gray and dotted purple lines, respectively) and for parameters of Petrov et al. (2016; dashed blue lines).
Current usage metrics show cumulative count of Article Views (full-text article views including HTML views, PDF and ePub downloads, according to the available data) and Abstracts Views on Vision4Press platform.
Data correspond to usage on the plateform after 2015. The current usage metrics is available 48-96 hours after online publication and is updated daily on week days.
Initial download of the metrics may take a while.