Fig. 8
Download original image
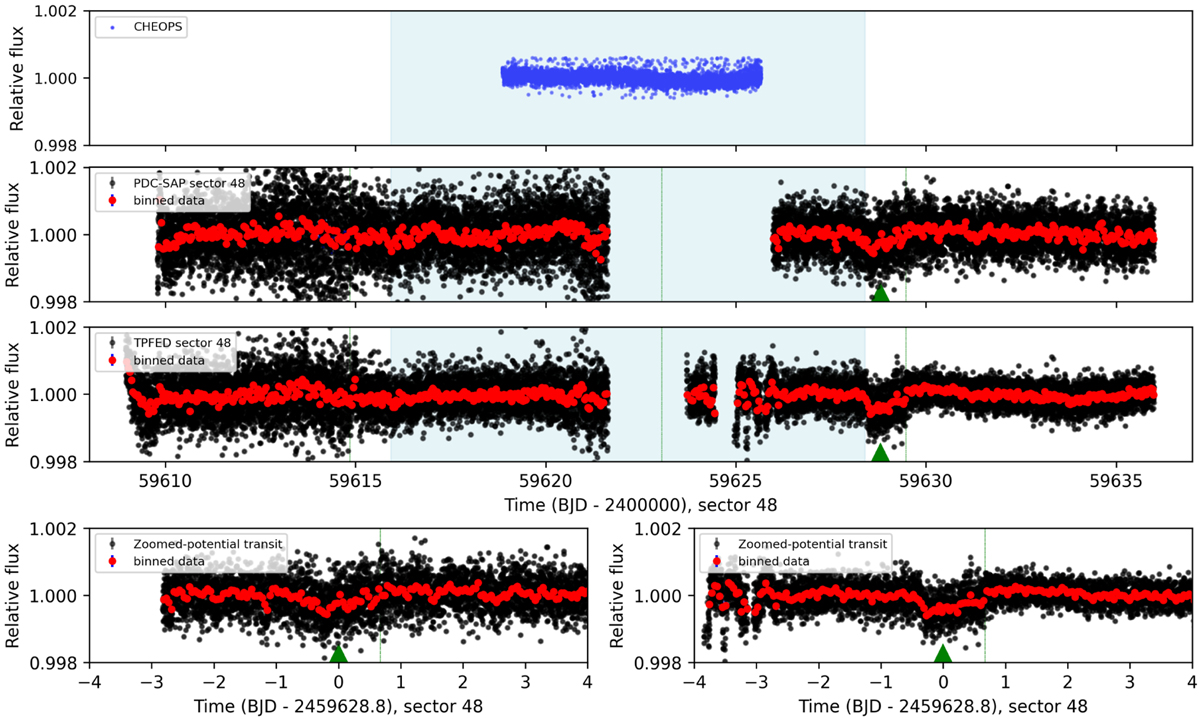
CHEOPS and TESS observations of HD 88986 in 2022 February. The predicted time of HD 88986 b’s second transit event, based on the best-fit model of combining RVs and the photometric light curve of sector 21 (see Sect. 7), is highlighted in blue. Top: CHEOPS photometric data. Second: TESS (black dots) PDC-SAP light curve of sector 48. The TESS data are binned (red points) in 1-hour increments. The potential transit-like feature is marked by a green triangle. The vertical dashed, green lines are the spacecraft momentum dumps. Third: re-extracted TESS light curve (see the text for more explanation). Bottom: zoomed on the potential transit event of HD 88986 b on PDC-SAP (left) and re-extracted (right) data. As the plot indicates, the two light curves are noticeably different. As a result, we did not include those data in our joint analysis presented in Sect. 7.
Current usage metrics show cumulative count of Article Views (full-text article views including HTML views, PDF and ePub downloads, according to the available data) and Abstracts Views on Vision4Press platform.
Data correspond to usage on the plateform after 2015. The current usage metrics is available 48-96 hours after online publication and is updated daily on week days.
Initial download of the metrics may take a while.