Fig. 7
Download original image
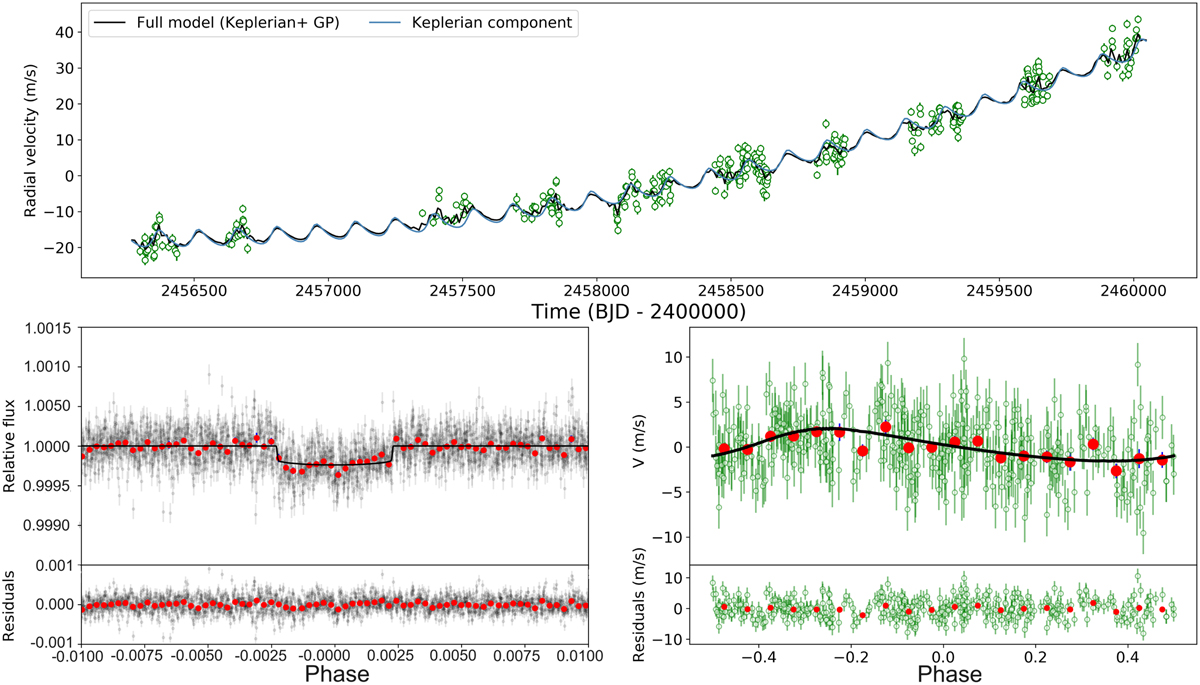
Joint analysis of SOPHIE+ and TESS sector 21 observations of HD 88986 b. Top: SOPHIE+ data overplotted by the best-fit orbit model. Bottom-left: phase-folded TESS PDC-SAP photometric data of sector 21. The data are binned (red points) in 1 hour. The black line shows the best-fit transit model. Bottom-right: phase-folded SOPHIE+ RVs of HD 88986 b at the period of 146.05 d. The red points depict the binned data, utilizing a bin size of 0.05 in orbital phase units. The black line represents the best-fit orbit model.
Current usage metrics show cumulative count of Article Views (full-text article views including HTML views, PDF and ePub downloads, according to the available data) and Abstracts Views on Vision4Press platform.
Data correspond to usage on the plateform after 2015. The current usage metrics is available 48-96 hours after online publication and is updated daily on week days.
Initial download of the metrics may take a while.