Fig. 6
Download original image
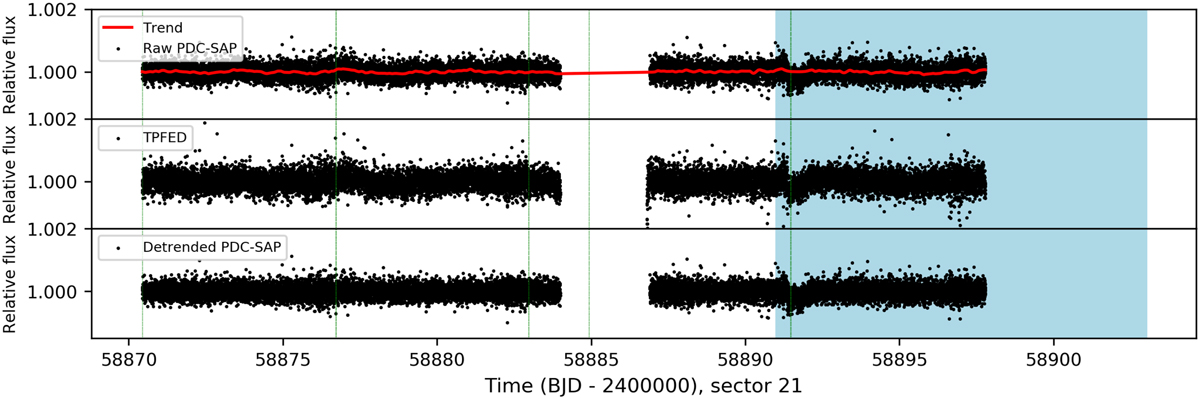
TESS observation of HD 88986 in sector 21 in 2020 February. Top: normalized TESS PDC-SAP light curve of sector 21 (black dots) along with the best-fit trend (red curve) to the data. The green vertical lines represent the times of the spacecraft’s momentum dumps. Middle: normalized re-extracted light curve of sector 21 (black dots). See the text for more information. Bottom: final detrended light curve. The expected HD 88986 b transit event from SOPHIE+ RVs (Sect. 5.3), with 1 sigma uncertainties, is highlighted in blue, and a single transit event is found in the TESS photometric data within this region.
Current usage metrics show cumulative count of Article Views (full-text article views including HTML views, PDF and ePub downloads, according to the available data) and Abstracts Views on Vision4Press platform.
Data correspond to usage on the plateform after 2015. The current usage metrics is available 48-96 hours after online publication and is updated daily on week days.
Initial download of the metrics may take a while.