Fig. G.2
Download original image
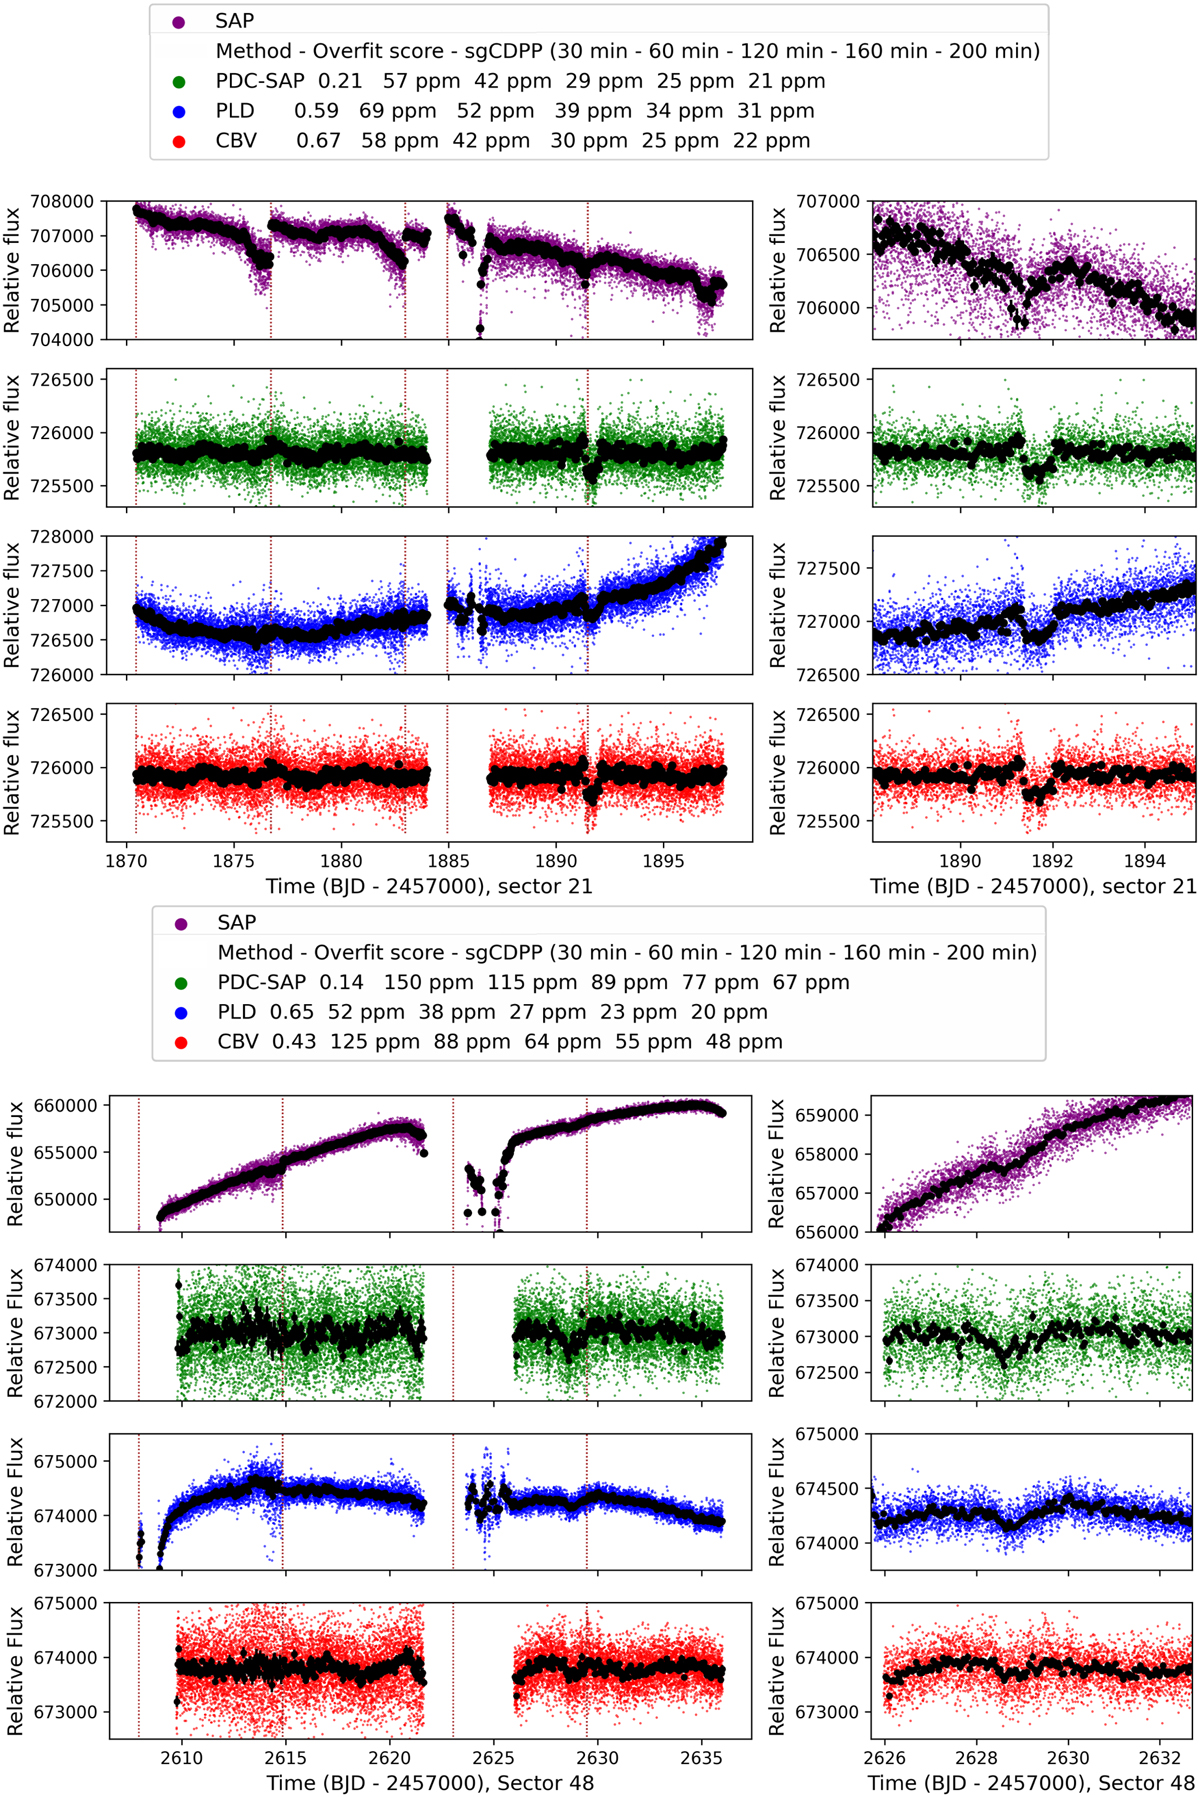
TESS light curves reproduced using PLD and CBV approaches (left panels) and zoomed in the potential single transits (right panels) for sector 21 (top) and sector 48 (bottom). The SAP and PDC-SAP data are also plotted to provide a reference for comparison. The data are binned (black points) in 1 hour. The legend includes an overfitting score and the sgCDPP metric to facilitate an assessment of the different light curves. The brown vertical lines are the telescope momentum dumps.
Current usage metrics show cumulative count of Article Views (full-text article views including HTML views, PDF and ePub downloads, according to the available data) and Abstracts Views on Vision4Press platform.
Data correspond to usage on the plateform after 2015. The current usage metrics is available 48-96 hours after online publication and is updated daily on week days.
Initial download of the metrics may take a while.